SLVUCE8A March 2022 – February 2023 TPS7H5001-SP
2.2 Running POP Analysis and AC Simulation
- Open TPS7H5001_SP_SIMPLIS_Flyback.sxsch
-
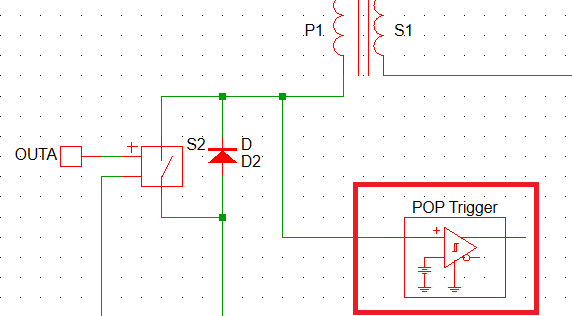
POP Trigger in the provided schematic should be connected to the primary side switch node of the converter for single frequency converters. Note that the POP Trigger requires the user to designate a switching node which is the least common multiple of the periodic frequencies present in the circuit. This can be an issue in power converters such as a full-bridge where some of the switch nodes are running at twice the frequency of the outputs of the device.
- Click Simulator → Choose Analysis.
-
Periodic Operating Point (POP) tab should be open
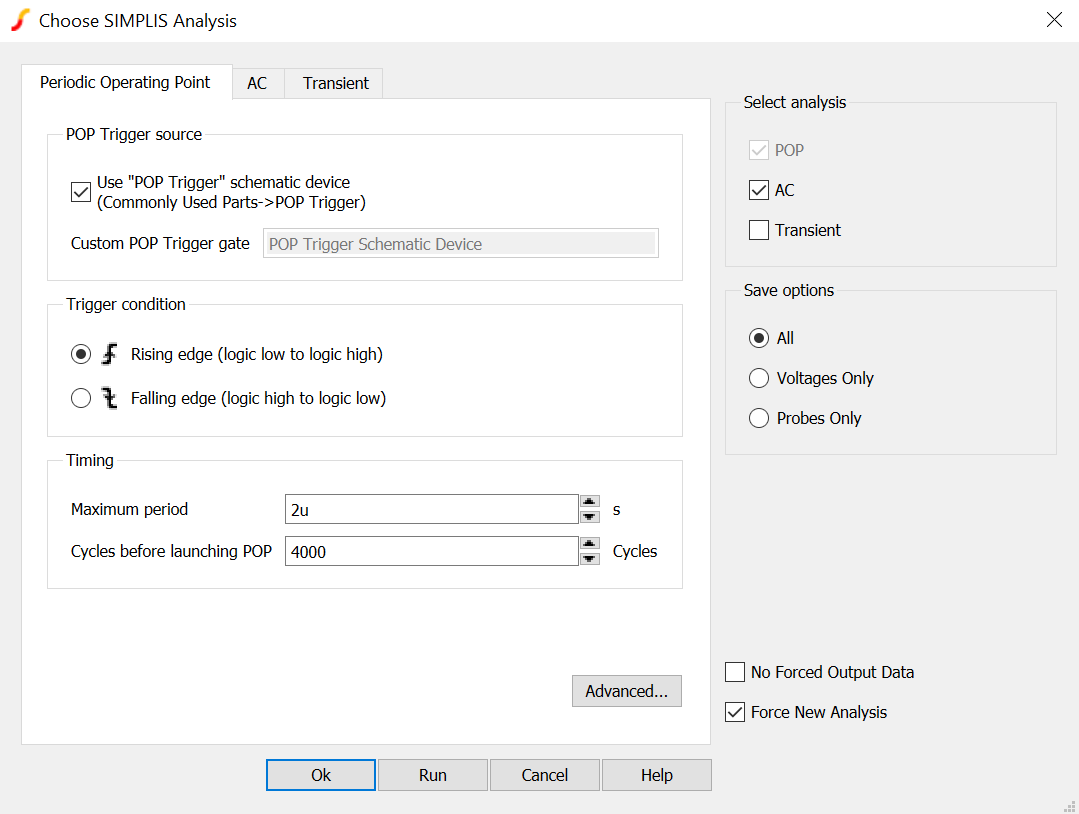
Default values for the schematic are 2us for the Maximum Period and 4000 Cycles before launching POP.
-
Maximum Period should be increased if the frequency of the converter decreases such that the Maximum Period is larger than the maximum period of the converter.
-
Cycles before launching POP needs to be larger such that the output of the converter reaches steady state by the time POP analysis starts. If this number is not large enough POP analysis will fail. There is a maximum of 8192 cycles. If the maximum amount of cycles is not large enough, the soft start capacitance of the converter may need to be decreased in order to allow the converter to start up faster and have the POP analysis converge. The POP analysis will try and start up the converter faster than normal, so the soft start function is not valid during this test.
-
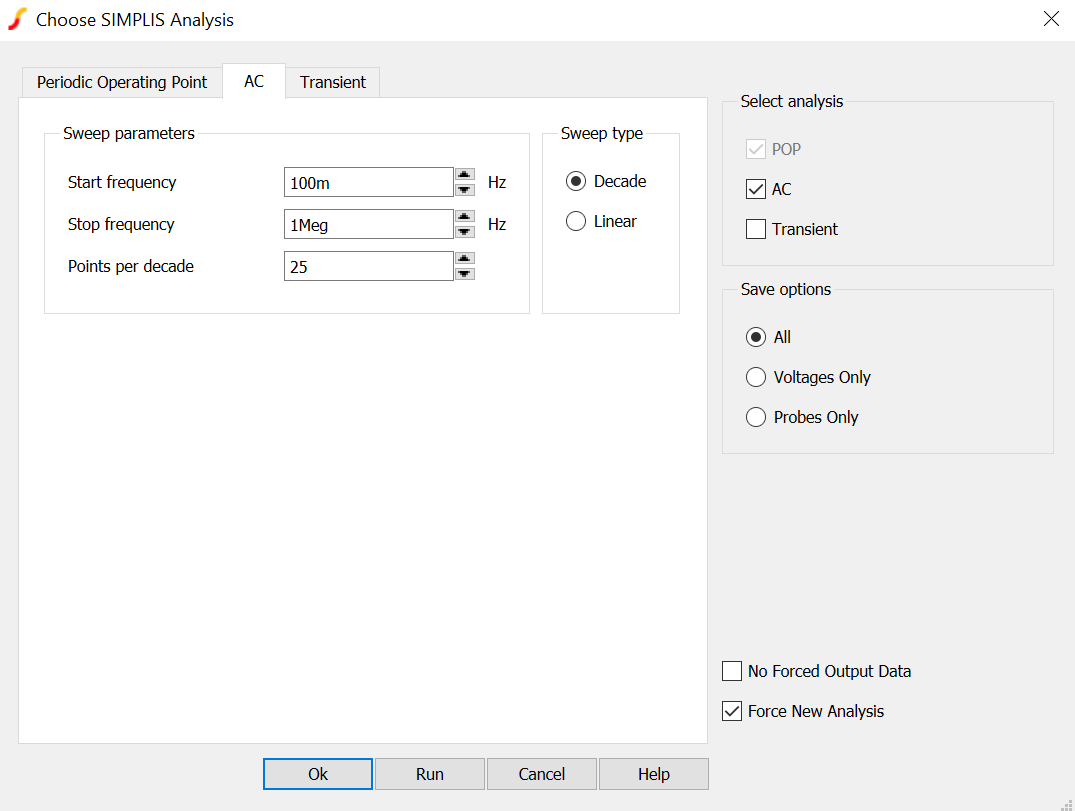
Open the AC tab
-
Start frequency is where the data will start to be taken for the frequency response and the stop frequency is where the data will stop being taken. Points per decade will simply effect how much data is taken for the test.
-
In Select Analysis on the right, select POP and AC and press run at the bottom