SSZT257 august 2020 TPS63900 , TPS63901
- 1
-
2
- 3
- Key design challenges when designing smart meter systems
- Power consumption profile for typical flow meters
- Best practices for designing meters with a buck-boost converter
- Best practice No. 1: Limit the peak current drawn from the battery.
- Best practice No. 2: Make the output and input voltage levels independent.
- Best practice No. 3: Use converters with a low operating current and a standby current below 500 nA.
- Best practice No. 4: Keep the voltage of the supply system as low as possible.
- Best practice No. 5: Optimize voltage load per operating mode with dynamic voltage scaling.
- Some measurements
- Additional resources
Flow meters use lithium manganese dioxide (LiMnO2) and lithium thionyl chloride (LiSOCl2) batteries as energy sources. LiSOCl2 batteries are popular in flow meters because they provide better energy density and a more efficient cost-per-wattage ratio than LiMnO2 batteries. However, LiSOCI2 batteries have a poor impulse response, which can lead to a large drop in voltage during transient current loading.
It is possible to combine buffer elements such as hybrid layer capacitors (HLCs) or electric double-layer capacitors with LiSOCl2 batteries to improve their pulse load capability, but a reliable combination of HLCs and LiSOCl2 batteries is costly and can impact the total cost of the meter. Because the battery also has an impact on the maintenance requirements and lifetime of a meter, an alternative method that combines buck-boost converters with LiSOCl2 batteries can help reduce overall solution costs and extend the lifetime of the meters.
In this article, I will review five best practices when working with buck-boost converters and LiSOCI2 batteries to maximize battery life and reduce overall maintenance and cost requirements. But first, let’s examine some common design challenges.
Key design challenges when designing smart meter systems
A typical flow meter system comprises five key components, including a metrology front end, communication front end, microcontroller (MCU), power-management integrated circuit and protection front end.
In addition to these requirements, flow meters usually come in small form factors and must operate for more than 15 years in the field with minimal maintenance.
Power consumption profile for typical flow meters
Table 1 lists the power consumption profile of a standard meter divided into three operating modes.
| Operating mode | Origin | Current range (A) | Impact on flow meter energy-management system |
|---|---|---|---|
| Standby mode | Metrology, MCU and protection | 5 µA to 100 µA | This is the main contributor to the lifetime of the meter. Thus, the efficiency of the supply system should be excellent (> 90%). |
| Middle stage mode | Communication front end in receiving mode | 2 mA to 10 mA | Some asynchronous radio-frequency (RF) protocols such as narrowband Internet of Things require the RF front end to stay in receiving mode. In such cases, supply system efficiency should remain excellent. |
| Active mode | Communication front end in transmitting mode | 20 mA and more | This is a main contributor to the degradation of a LiSOCI2 battery. Thus, the supply system should allow the limitation of the peak current drawn from the battery while maintaining good efficiency (>80%). In general, the system is in active mode for 2 minutes every 24 hours, depending on the communication system implemented. |
Best practices for designing meters with a buck-boost converter
To help extend the battery life and performance of your smart meter design, consider these five best practices.
Best practice No. 1: Limit the peak current drawn from the battery.
As you can see in Figure 1 (from the data sheet of a SAFT LS17330 battery), LiSOCl2 batteries usually do not support the high dynamic range profiles required by radio communication systems used in smart meters. One approach to overcome this issue is to use the TPS63900 buck-boost converter and a buffer element to filter the battery current.
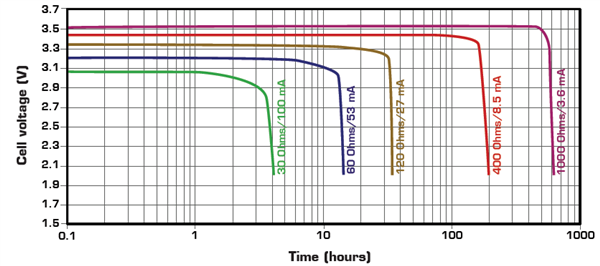 Figure 1 SAFT LS17330 typical discharge profiles at +20°C
Best practice No. 2: Make the output and input voltage levels independent.
Implementing independent voltage levels optimizes the input current profile drawn from the battery and the output current provided to the load. This practice also simplifies the usage of the buffer element between the input and output.
Best practice No. 3: Use converters with a low operating current and a standby current below 500 nA.
In order to optimize the system’s energy use, the average current consumption of the converter must be negligible in comparison to the current consumption of the system. For example, if the average current consumption of a flow meter is around 5 µA, the converter should have a standby current below 500 nA.
Best practice No. 4: Keep the voltage of the supply system as low as possible.
Think of the system as a resistance supplied by the converter. Keeping the supply voltage low enables a reduction in the standby current consumed by the system.
Best practice No. 5: Optimize voltage load per operating mode with dynamic voltage scaling.
As Figure 2 illustrates, the TPS63900’s dynamic voltage scaling feature enables the converter to change its output voltage on the fly and thereby power the load at its best operating point.
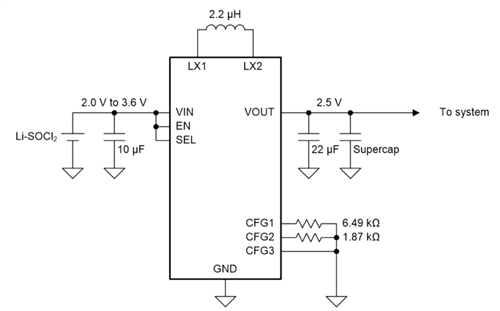 Figure 2 TPS63900 based battery front end
Some measurements
Let’s take a load transient measurement with these conditions:
- Standby current (Iout): 158 µA during 999 ms
- Active current (Iout): 97.4 mA during 1 ms
- Input voltage (Vin): 3.6 V,
- Output voltage: 3.0 V
- Output capacitor: 300 µF
As shown in Figure 3 and Figure 4, the TPS63900 is capable of filtering the input current drawn from the battery while maintaining excellent efficiency and regulation on the output voltage.
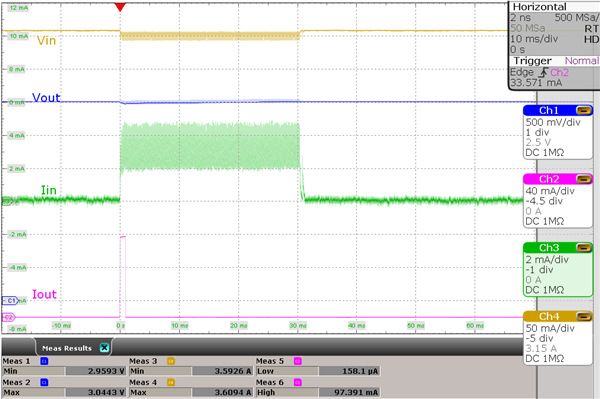 Figure 3 The pulse response of the TPS63900
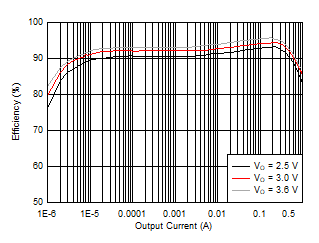 Figure 4 TPS63900 efficiency with an input voltage of 3.6 V
By combining ultra-low standby current consumption, excellent transient response, output noise level, and dynamic voltage scaling in a 2.5-mm-by-2.5-mm package or 21-mm2 total solution size, the TPS63900 can help resolve challenges when working with LiSOCl2 batteries and solved for a long time by conventional, more complex and costly approaches.
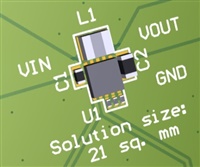 Figure 5 TPS63900 solution area
For more information about designing with the TPS63900 buck-boost converter, see the additional resources or comment on this article.
Additional resources
- Watch the training video, "TPS63900 - dynamic voltage scaling and input current limit."
- Read the application note, “How to extend operating time of a LiSOCl2 powered system.”
- Discover the reference design, “Low-Power Options for Smart Meter Wireless Modules Using Primary Cells Reference Design.”
- Read the EE Design News article, “Smarter power for the front-end of the Internet of Things.”
- Check out the SAFT LS17330 data sheet.