SWRU587A November   2021  – March 2023 AWR2944


  1.   Trademarks
  2. 1Setup Instructions
    1. 1.1 Browser Setup (First Time Only)
    2. 1.2 mmWave Device Setup
    3. 1.3 Serial Port Setup
  3. 2CONFIGURE Tab
    1. 2.1  Platform
    2. 2.2  SDK Version
    3. 2.3  Antenna Config (Azimuth Resolution - Degrees)
    4. 2.4  Processing Chain
    5. 2.5  Desirable Configuration
    6. 2.6  Frequency Band (GHz)
    7. 2.7  Scene Selection – Best Range Resolution
      1. 2.7.1 Frame Rate (fps)
      2. 2.7.2 Range Resolution (m)
      3. 2.7.3 Maximum Unambiguous Range (m)
      4. 2.7.4 Maximum Radial Velocity (m/s)
      5. 2.7.5 Radial Velocity Resolution (m/s)
    8. 2.8  Scene Selection – Best Velocity Resolution
      1. 2.8.1 Frame Rate (fps)
      2. 2.8.2 Radial Velocity Resolution (m/s)
      3. 2.8.3 Maximum Radial Velocity (m/s)
      4. 2.8.4 Range Resolution (m)
      5. 2.8.5 Maximum Unambiguous Range (m)
    9. 2.9  Scene Selection – Best Range
      1. 2.9.1 Frame Rate (fps)
      2. 2.9.2 Maximum Unambiguous Range (m)
      3. 2.9.3 Range Resolution (m)
      4. 2.9.4 Maximum Radial Velocity (m/s)
    10. 2.10 Plot Selection
      1. 2.10.1 Scatter Plot
      2. 2.10.2 Range Profile
      3. 2.10.3 Noise Profile
      4. 2.10.4 Range Azimuth Heat Map
      5. 2.10.5 Range Doppler Heat Map
      6. 2.10.6 Statistics
    11. 2.11 User Selected Configuration
      1. 2.11.1 Send Configuration to mmWave Device
      2. 2.11.2 Saving Configuration to PC
      3. 2.11.3 Reset Selection
  4. 3PLOTS Tab
    1. 3.1  X-Y Scatter Plot
    2. 3.2  Doppler Range Plot
    3. 3.3  Range Profile
    4. 3.4  CPU Load
    5. 3.5  Range-Doppler Heatmap
    6. 3.6  Range-Azimuth Heatmap
    7. 3.7  3-D Scatter Plot
    8. 3.8  Display Parameters
      1. 3.8.1 Profiling Parameters
      2. 3.8.2 Scene Parameters
      3. 3.8.3 Chirp/Frame Parameters
    9. 3.9  Real-Time Tuning
      1. 3.9.1 Group Peaks From Same Object
      2. 3.9.2 Static Clutter Removal
      3. 3.9.3 Range Detection Threshold (0 to 100 dB)
      4. 3.9.4 Doppler Detection Threshold (0 to 100 dB)
    10. 3.10 Advanced Commands
      1. 3.10.1 Special Note About Range and Angle Bias Compensation Configuration
    11. 3.11 Plot Settings
  5. 4Advanced Options
    1. 4.1 Load Configuration From PC
    2. 4.2 Getting the Version
    3. 4.3 RCS
      1. 4.3.1 Desired Radar Cross Section (sq. m)
      2. 4.3.2 Maximum Range for Desired RCS (m)
      3. 4.3.3 RCS at Maximum Unambiguous Range (sq. m)
    4. 4.4 Concurrent Recording of Processed Stream From mmWave Device
  6. 5Troubleshooting
    1. 5.1 Console Message: Errors Returned by Device
    2. 5.2 Serial Port Status Message: Not Switching to Hardware Connected or Both Ports Are Not Showing Up
    3. 5.3 Console Message: sensorStart Message Not Sent to Host
    4. 5.4 Warning for Plots and Frame Rate
    5. 5.5 Configuration Successful, but Plots Not Updating
  7. 6Customizing the mmWave Demo Visualizer
  8.   Revision History

Send Configuration to mmWave Device

This lets users send the generated configuration (CLI) commands to be sent to the target (mmWave sensor) device. This command operates successfully only if the following are met:

  • Valid serial ports have been configured as shown in the setup section.
  • Target (mmWave sensor) device is booted up and running the mmWave demo from the same SDK version as selected in the SDK version drop down menu.

Users can see the commands echoed back on the Console Messages display with the feedback that is received from the target for every line of commands sent. These console messages are a great help when debugging issues or getting familiar with the CLI commands. A successful execution of this button results in the last command sensorStart to be sent to the device and a response Done to be received from the device.

Another indication of successful connectivity to the target device is the black status bar on the bottom of the page shows two valid COM ports and the status says Hardware Connected (see Figure 2-1). After successful execution, users can switch to the Plots tab to view the requested plots.
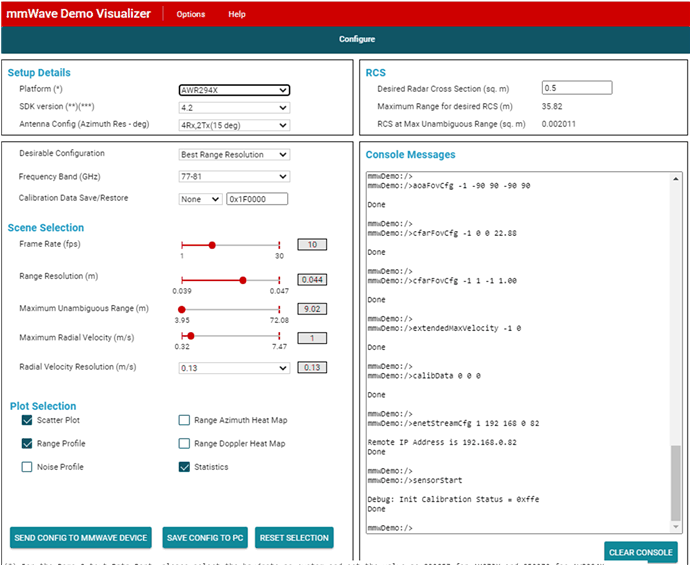
GUID-ABBB00B4-C2BE-4B88-BD96-BBC82CDBE4BA-low.gif Figure 2-1 Valid Configuration

If the last two lines in the console messages contain any other lines than these, it means either the device generated an error, the device stopped responding, or the commands did not go through completely and the user must try again. For more details, see Section 5.