TIDT192 October   2020


  1.   Description
  2. 1Test Prerequisites
    1. 1.1 Voltage and Current Requirements
    2. 1.2 Required Equipment
    3. 1.3 Considerations
    4. 1.4 Dimensions
  3. 2Testing and Results
    1. 2.1 Efficiency Graphs
    2. 2.2 Thermal Images
    3. 2.3 Frequency Response
  4. 3Waveforms
    1. 3.1 Start-up
    2. 3.2 Switching Waveforms

Thermal Images

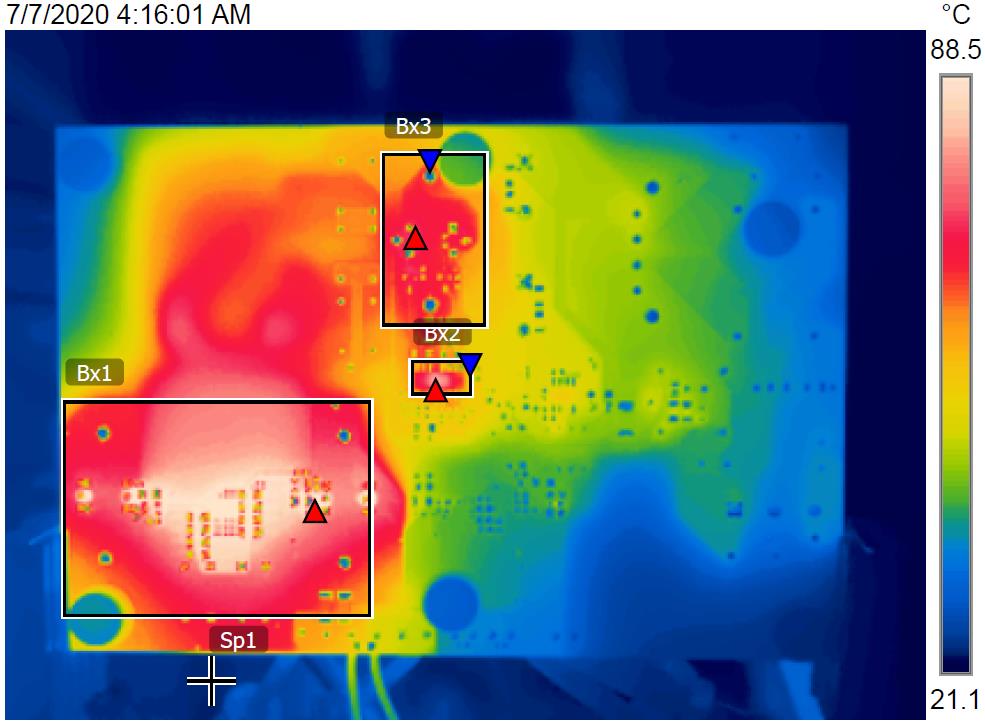
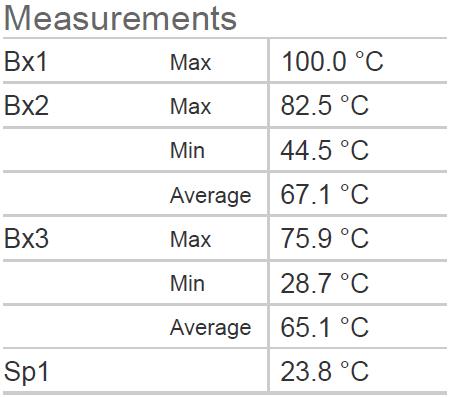
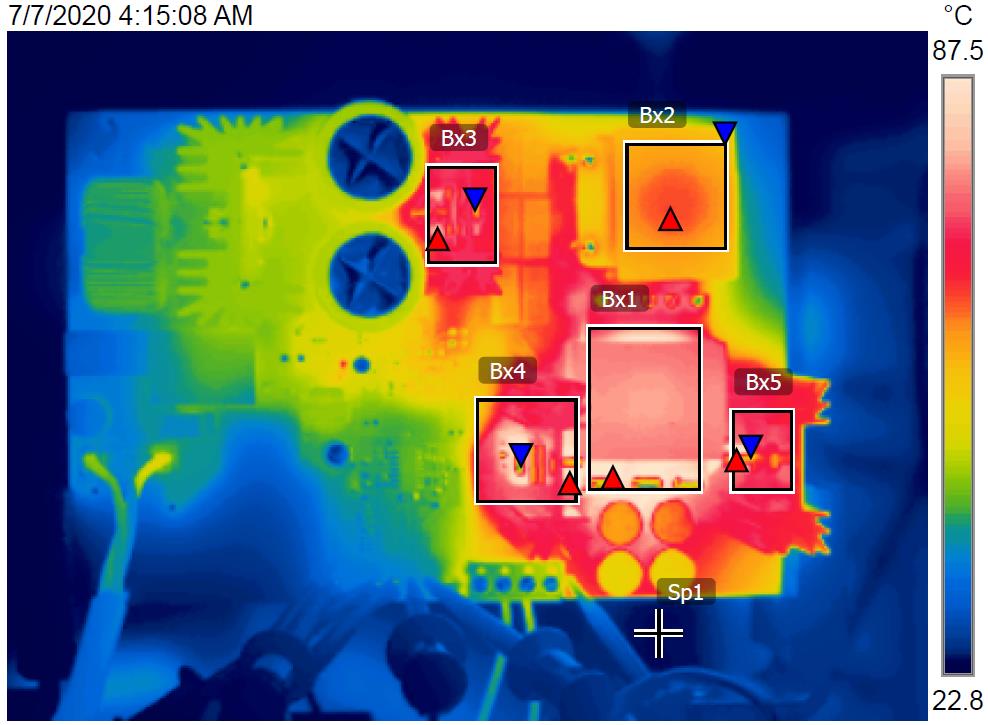
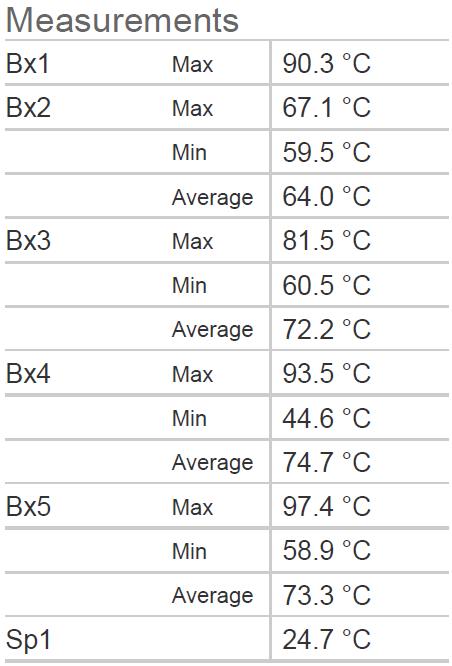
The following thermal images show a top view and bottom view of the board. The ambient temperature is 20ºC with no forced air flow. The input is at 120 VAC and the output is at 22-V, 12-A loads.
GUID-20200729-CA0I-SLVQ-LKFT-P1WXMCP6JQS6-low.jpgGUID-20200729-CA0I-6C70-VRTQ-4RPZ9MFDV5XC-low.jpgFigure 2-3 Top-Side Thermal Image
GUID-20200729-CA0I-BSVR-CW6D-QZNWK2XKF9KR-low.jpgGUID-20200729-CA0I-9DCH-LP55-SGD4ZL1FHQ6N-low.jpgFigure 2-4 Bottom-Side Thermal Image .