TIDT205 February 2021
4.4 Start-up Sequence
The following images show the start-up profiles of each converter. Smooth start-up is observed for each converter.
CH 2 (Pink trace) Input Voltage
CH 3 (Blue trace): Output Voltage
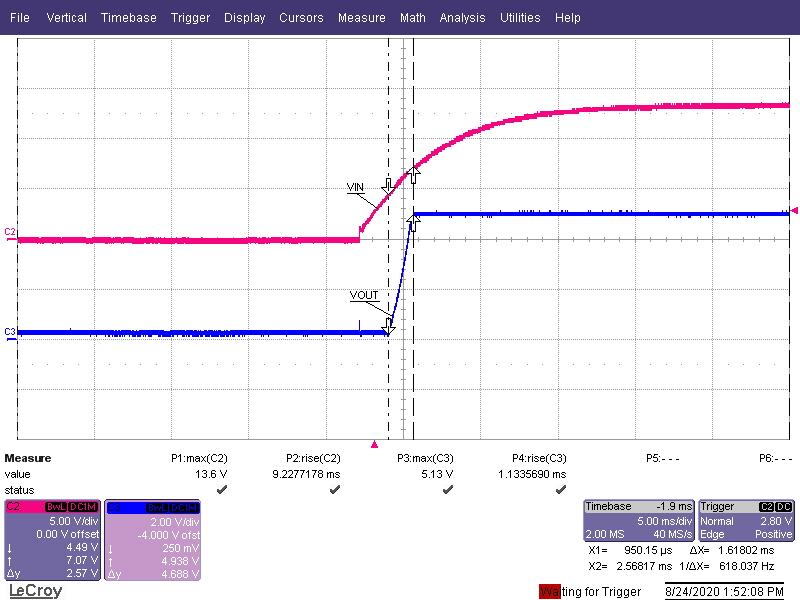 Figure 4-16 Start-up (VOUT = 5 V)
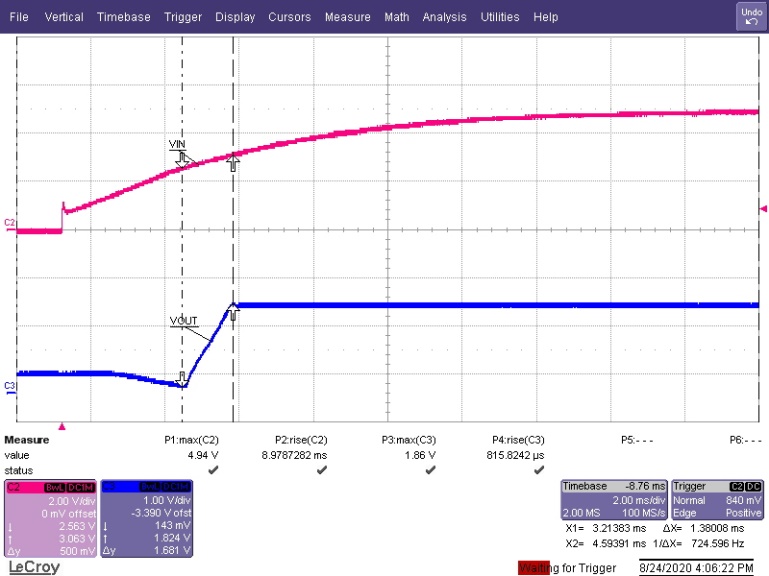 Figure 4-18 Start-up (VOUT = 1.8 V)
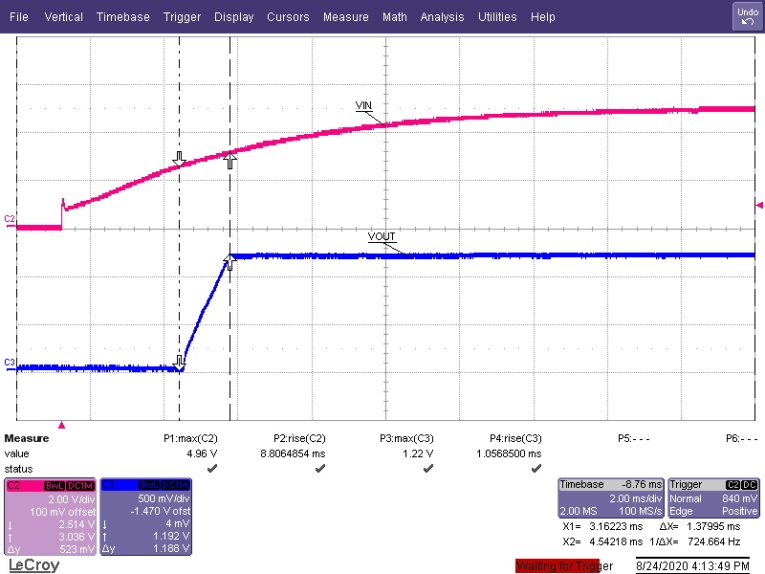 Figure 4-20 Start-up (VOUT = 1.175 V)
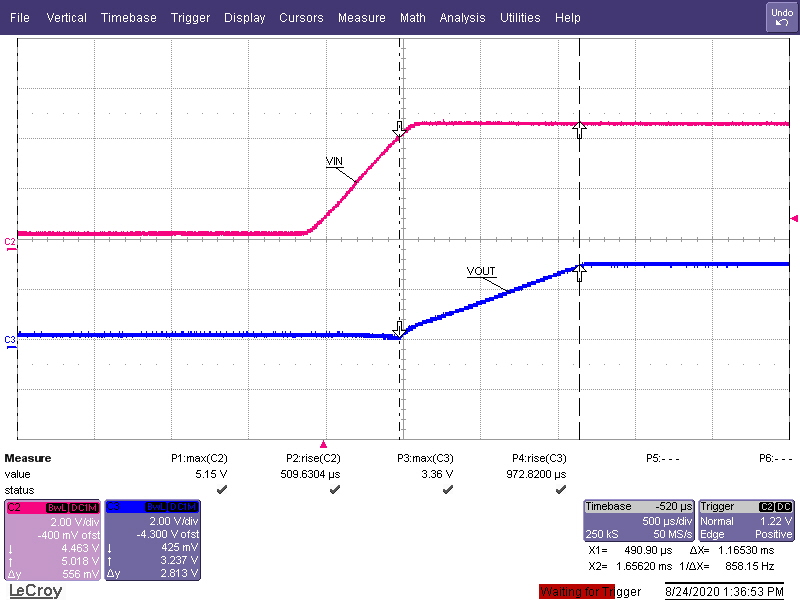 Figure 4-17 Start-up (VOUT = 3.3 V)
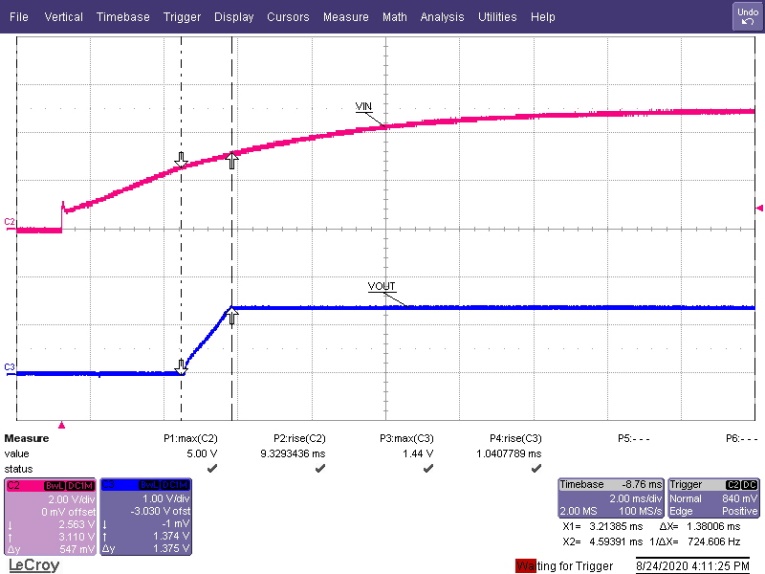 Figure 4-19 Start-up (VOUT = 1.35 V)