TIDT294 June   2022


  1.   Description
  2.   Features
  3.   Applications
  4. 1Test Prerequisites
    1. 1.1 Voltage and Current Requirements
    2. 1.2 Dimensions
  5. 2Test Results
    1. 2.1 Efficiency Graphs
    2. 2.2 THD
    3. 2.3 Data
    4. 2.4 Thermal Performance
  6. 3Waveforms
    1. 3.1 Switching Waveforms

Efficiency Graphs

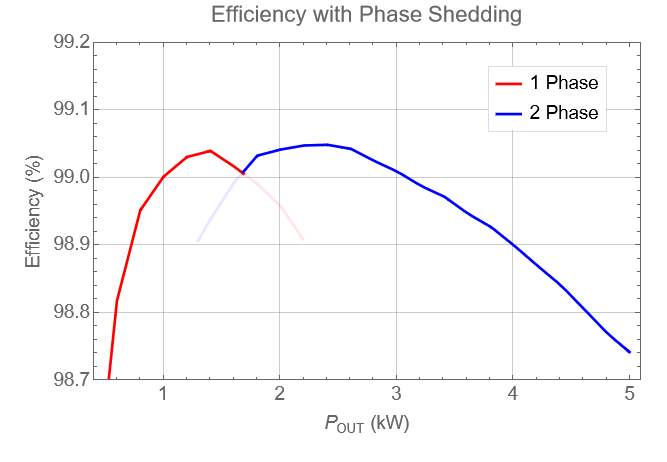
Efficiency is shown in the following figure. The enhanced efficiency at lighter loads is enhanced by turning off one of the phases. This, along with the high-efficiency enabled by the GaN switches and the ZVS control, enables a flat efficiency over a wide operating range.
GUID-20220607-SS0I-DPNZ-GF91-BC7PPQBQFLN2-low.png

VIN = 230 VRMS

VOUT = 400 V

Figure 2-1 Efficiency Graph