TIDUEY3 November 2020
2.3.2 Low-Level Processing
An example of a processing chain for overhead in-cabin sensing is implemented on the AWR6843AOP EVM.
The processing chain is implemented on the DSP and Cortex-R4F together. Table 2-2 lists the several physical memory resources used in the processing chain.
| SECTION NAME | SIZE (KB) AS CONFIGURED | MEMORY USED (KB) | DESCRIPTION |
|---|---|---|---|
| L1D SRAM | 16 | 16 | Layer one data static RAM is the fastest data access for DSP and is used for most time-critical DSP processing data that can fit in this section. |
| L1D cache | 16 | 16 | Layer one data cache caches data accesses to any other section configured as cacheable. LL2, L3, and HSRAM are configured as cache-able. |
| L1P SRAM | 28 | 28 | Layer one program static RAM is the fastest program access RAM for DSP and is used for most time-critical DSP program that can fit in this section. |
| L1P cache | 4 | 4 | Layer one cache caches program accesses to any other section configured as cacheable. LL2, L3, and HSRAM are configured as cache-able. |
| L2 | 256 | 2328 | Local layer two memory is lower latency than layer three for accessing and is visible only from the DSP. This memory is used for most of the program and data for the signal processing chain. |
| L3 | 768 | 744 | Higher latency memory for DSP accesses primarily stores the radar cube and the range-azimuth heat map. It also stored system code not required to be executed at high speed. |
| HSRAM | 32 | 20 | Shared memory buffer used to store slow, non-runtime code. |
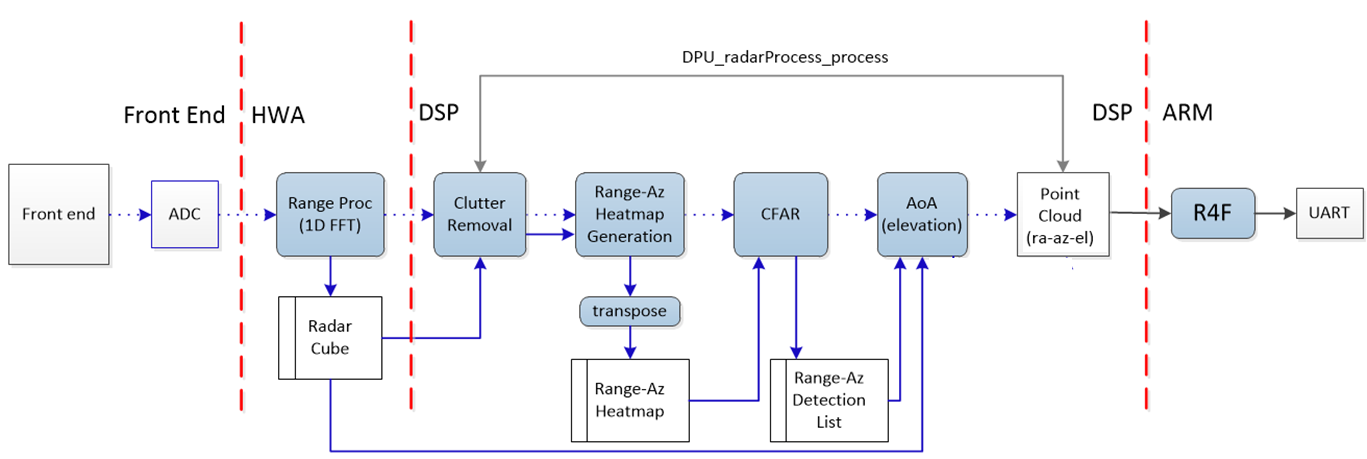
 Figure 2-5 Processing Chain Flow:
Detection Tracking Visualization
Figure 2-5 Processing Chain Flow:
Detection Tracking VisualizationAs shown in Figure 2-5, the implementation of the over in-cabin sensing example in the signal-processing chain consists of the following blocks implemented on both the DSP and Cortex R4F. In the following section we break this process into the following smaller blocks:
- Range FFT through Range Azimuth Heatmap with Capon BF
- Object Detection with CFAR and Elevation Estimation
- As shown in the block diagram, Raw Data is processed with a 1-D FFT (Range Processing) and Static Clutter Removal is applied to the result. Then Capon Beamforming is used to generate a range-azimuth heatmap. These are explained in depth below.
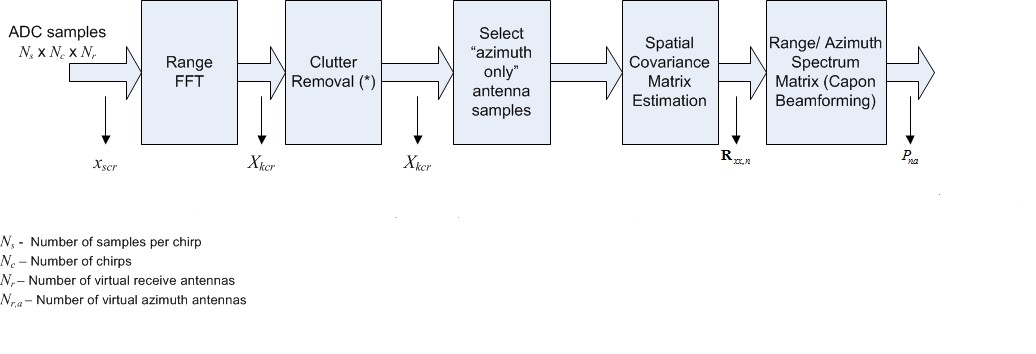
 Figure 2-6 Range FFT through
Range-Azimuth Heatmap
Figure 2-6 Range FFT through
Range-Azimuth Heatmap- For each antenna, EDMA is used to move samples from the ADC output buffer to the FFT Hardware Accelerator (HWA), controlled by the CortexR4F. A 16-bit, fixed-point 1D windowing and 16-bit, fixed-point, 1D FFT are performed. EDMA is used to move output from the HWA local memory to the radar cube storage in layer three (L3) memory. Range processing is interleaved with active chirp time of the frame. All other processing occurs each frame, except where noted, during the idle time between the active chirp time and the end of the frame.
- Once the active chirp time of the
frame is complete, the inter-frame processing can begin, starting with static
clutter removal. 1D FFT data is averaged across all chirps for a single Virtual
Rx antenna. This average is then subtracted from each chirp from the Virtual Rx
antenna. This cleanly removes the static information from the signal, leaving
only the signals returned from moving objects. The formula is Equation 1.
- With Nc = Number of chirps; Nr = Number of recieve antennas; Xnr = Average samples for a single receive antenna across all chirps; Xncr = Samples of a Single Chirp from a receive antenna
- The Capon BF algorithm is split into two components: 1) the Spatial Covariance Matrix computation and 2) Range-Azimuth Heatmap Generation. The final output is the Range-Azimuth heatmap with beamweights. This is passed to the CFAR algorithm.
- Spatial Covariance Matrix is calculated as the following:
- First, the spacial
covariance matrix is estimated as an average over the chirps in the
frame as Rxx,n which is 8x8 for ISK and 4x4 for ODS:
Equation 2.
- Second, diagonal loading is
applied to the R matrix to ensure stability Equation 3.
- First, the spacial
covariance matrix is estimated as an average over the chirps in the
frame as Rxx,n which is 8x8 for ISK and 4x4 for ODS:
- First, the Range-Azimuth Heatmap Pna is calculated using the following equations
- Subscript a indicates values across
azimuth bins Equation 4.
- In AOP antenna pattern, there are
two sets of antennas that can be used for range-azimuth heatmap generation. In
this application, the two sets are combined as defined below to achieve the
final range-azimuth heatmap. Where Pna1 represent the heatmap
generated from the first set of azimuth antenna array using equation and
Pna2 represent the heatmap generated from the second set
of azimuth antenna array. Equation 5. Pna=Pna12+Pna22
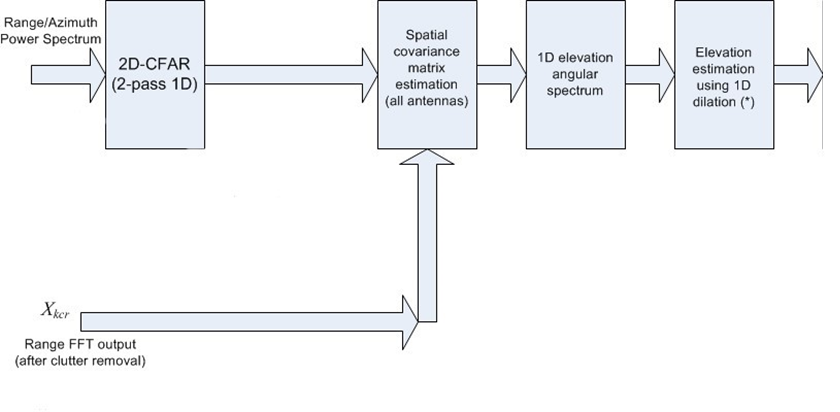
- Using the heatmap generated in the above steps, 2 Pass CFAR is used to generated detected points in the Range-Azimuth spectrum. For each detected point, Capon is applied to generate a 1D elevation angular spectrum, which is used to determine the elevation angle of the point
 Figure 2-7 CFAR and Elevation
Estimation
Figure 2-7 CFAR and Elevation
Estimation- Two pass CFAR algorithms is used on the range azimuth heat map to perform the object detection using the CFAR smallest of method. First pass is done per angle bin along the range domain. Second pass in the angle domain is used confirm the detection from the first pass. The output detected point list is stored in L2 memory.
- Full 2D 12 antenna Capon
Beamforming is performed at the azimuth of each detected point. This is done
following the same steps used to generate the range-azimuth heatmap:
- Generate spacial covariance matrix
- Generate 1D elevation angle spectrum (similar to the heatmap)
- Then a single peak search is performed to find the elevation angle of each point. This step does not generate new detection points.
- Spatial Covariance matrix is
similar to before, with input based on detections Equation 6.
- With diagonal loading matrix
Equation 7.
- 1D Elevation Spectrum is as follows
Equation 8.
All the above processing except the range processing happens during inter-frame time. After DSP finishes frame processing, the results are written in shared memory (L3/HSRAM) for Cortex-R4F to input for the group tracker.
Zone Occupancy Detection- This algorithm implements the localization processing and works on the point cloud data from DSP. Using range, azimuth, elevation, and SNR for each point in the point cloud, it outputs occupancy decision for each defined zone.
Table 2-3 lists the results of benchmark data measuring the overall MIPS consumption of the signal processing chain running on the DSP. Time remaining assumes a 50 ms total frame time.
| PARAMETER | TIME USED (ms) | LOADING (ASSUMING 200 ms FRAME TIME) |
|---|---|---|
| Active Frame time | 158.76 | 79.4% |
| Remaining Inter-Frame Time | 41.24 | 20.6% |
| Range-Azimuth Heatmap Generation | 2.18 | 1.09% |
| 2 Pass CFAR | 0.30 | 0.15% |
| Elevation Estimation | 2.76 | 1.38% |
| Zone Assignment (not currently running on DSP) | 2.0 (estimate) | 1% |
| Occupancy State Machine (not currently running on DSP) | 1.0 (estimate) | 0.5% |
| Total Active Inter-Frame Time | 7.24 | 3.62% |
| Total Time | 36.235 | 18.11% |