SBAA487 January 2021 ADS8664 , ADS8668 , ADS8674 , ADS8678 , ADS8684 , ADS8684A , ADS8686S , ADS8688 , ADS8688A , ADS8694 , ADS8698
4.1.1 Measured Phase Delay without Averaging – 50Hz Sinusoidal Fundamental Signal
In this case, one pure sinusoidal signal with ±10V signal amplitude and 50Hz signal frequency from the signal generator, which is the fundamental signal of power line in grid infrastructure application, is applied to all 8 input channels of ADS8686S on the EVM board.
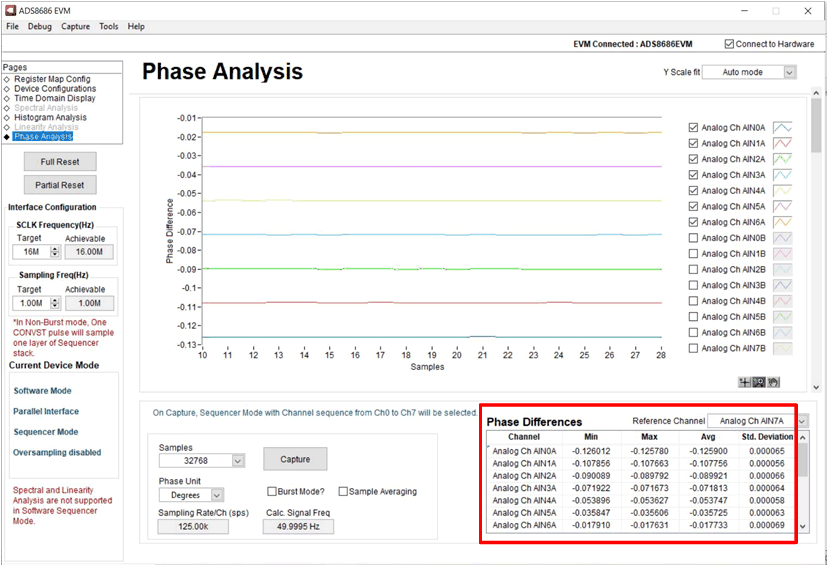
To get closer to the real system in grid infrastructure application, the sequencer is programed to sample all signals applied to the 8 input channels of the ADS8686S ADC. When the Phase Analysis page in the GUI software is selected, the sequencer is configured with the sequence introduced in Section 3.1 and Figure 3-1 by choosing the AINxA channels on the top right of the Phase Analysis page.
By default, the phase unit is degree also the Burst mode is checked and enabled in the Phase Analysis page, however the Sampling Averaging option is not enabled. Selecting Continuous in the Capture menu enables continuous data capture and process. The Phase Analysis software can be executed by clicking the Capture button, then the phase delay between channels are shown. Also, the Phase Analysis can quickly track any change of signal frequency with minimum cycles of sampled data on reference channel.
The default reference channel is AIN0A, however other channels can be also chosen. When the AIN7A is selected as reference channel, the phase delay are negative because the ADC scans the channels from AIN0A to AIN7A, thus the phase angle of AIN7A channel is lagging the phase angle of the rest of channels.
The measured phase delay between channels without averaging is shown in Table 4-1.
| Theoretical Delay ∆θ (º) | Measured Phase Delay ∆θ (º) | ||
|---|---|---|---|
| Phase Delay | Mean | ||
| Phase difference (AIN0A – AIN7A) | - 0.126º | - 0.125900º | 0.000065º |
| Phase difference (AIN1A – AIN7A) | - 0.108º | - 0.107756º | 0.000056º |
| Phase difference (AIN2A – AIN7A) | - 0.090º | - 0.089921º | 0.000066º |
| Phase difference (AIN3A – AIN7A) | - 0.072º | - 0.071813º | 0.000064º |
| Phase difference (AIN4A – AIN7A) | - 0.054º | - 0.053747º | 0.000058º |
| Phase difference (AIN5A – AIN7A) | - 0.036º | - 0.035725º | 0.000063º |
| Phase difference (AIN6A – AIN7A) | - 0.018º | - 0.017733º | 0.000069º |
| Reference Channel – AIN7A | 0º | 0º | |
 Figure 4-2 Phase Analysis - Phase Delay without
Sample Averaging