SLAU776A May 2018 – December 2023
- 1
- Abstract
- Trademarks
- 1Introduction
- 2Equipment
-
3Setup Procedure
- 3.1 Install the High Speed Data Converter (HSDC) Pro Software
- 3.2 Install the Configuration GUI Software
- 3.3 Connect the EVM and TSW14DL3200EVM
- 3.4 Connect the Power Supplies to the Boards (Power Off)
- 3.5 Connect the Signal Generators to the EVM (*RF Outputs Disabled Until Directed)
- 3.6 Turn On the TSW14DL3200EVM Power and Connect to the PC
- 3.7 Turn On the ADC12DLXX00EVM 5-V Power Supply and Connect to the PC
- 3.8 Turn On the Signal Generator RF Outputs
- 3.9 Open the ADC12DLXX00EVM GUI and Program the ADC and Clocks
- 3.10 Calibrate the ADC Device on the EVM
- 3.11 Open the HSDC Software and Load the FPGA Image to the TSW14DL3200EVM
- 3.12 Capture Data Using the HSDC Pro Software
- 4Device Configuration
- A Troubleshooting the ADC12DL3200EVM
- B Optional ADC12DL3200EVM Configurations
- C Revision History
3.12 Capture Data Using the HSDC Pro Software
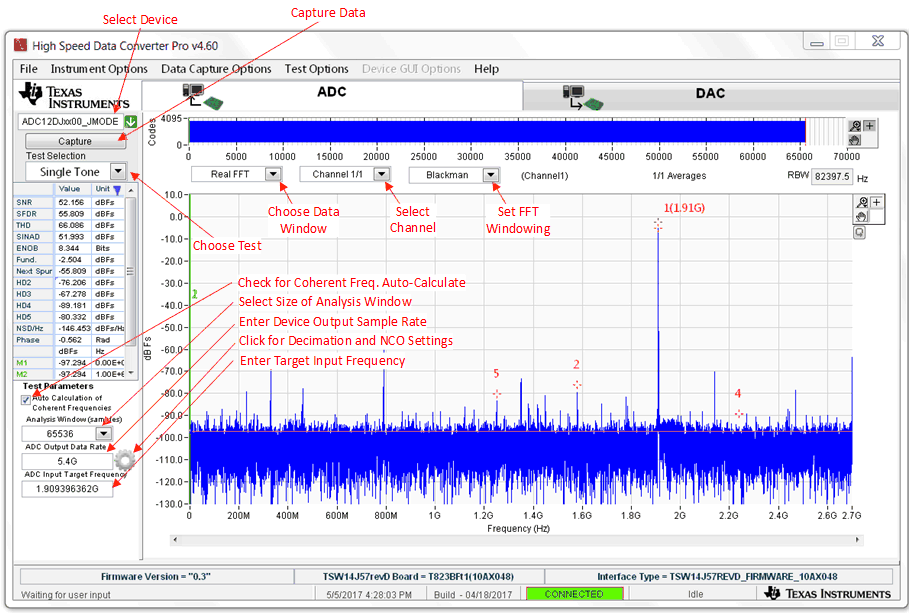
Figure 3-4 shows the HSDC Pro GUI. The following steps show how to capture data using the HSDC Pro software (see ):
- Select the test to perform.
- Select the data view.
- Select the channel to view.
- Click the Capture button to capture new data.
Additional tips:
- Use the Notch Frequency Bins from the Test Options file menu to remove bins around DC (eliminate DC noise and offset) or the fundamental (eliminate phase noise from signal generators).
- Open the Capture Option dialog from the Data Capture Options file menu to change the capture depth or to enable Continuous Capture or FFT averaging.
- For analyzing only a portion of the spectrum, use the Single Tone test with the Bandwidth Integration Markers from the Test Options file menu. The Channel Power test is also useful.
- For analyzing only a subset of the captured data, set the Analysis Window (samples) setting to a value less than the number of total samples captured and move the green or red markers in the small transient data window at the top of the screen to select the data subset of interest.
 Figure 3-4 HSDC Pro GUI