SLDA058 March 2021 TUSS4470
- Trademarks
- 1Review of Ultrasonic Sensing Range Performance Factors
- 2Methods Overview
- 3Short Range Air-Coupled Test Results
- 4Mid-Range Air-Coupled Test Results
- 5Short Range Water-Coupled Test Results
- 6Resistive Damping Device Comparison
- 7Summary
- 8References
- A Appendix A
- B Appendix B
6.1 TUSS4470
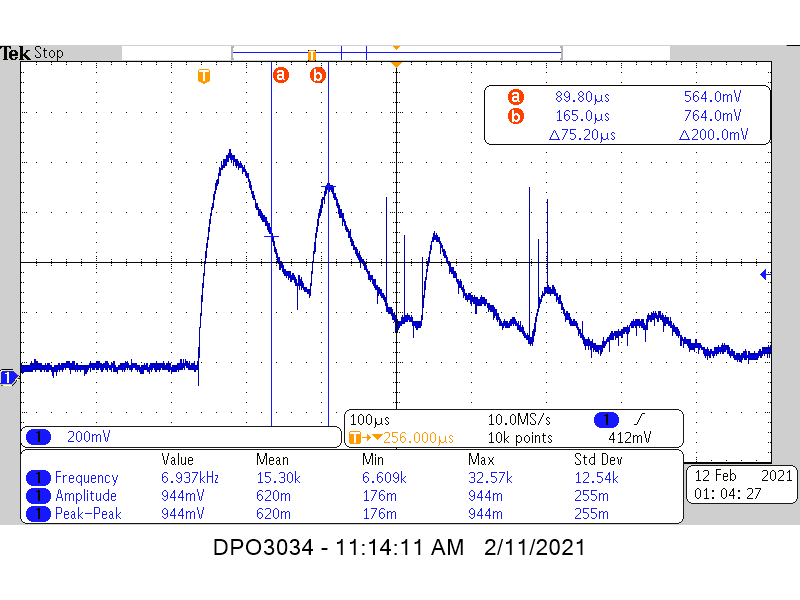
Figure 6-1 shows the TUSS4470 VOUT signal: undamped, 500Ω damped, and 75Ω damped, respectively. Cursors show the distance between the TX pulse and the first return echo pulse. To quantify the damping effect, cursor 'a' is placed to cross VOUT on the TX pulse approximately at the voltage level bisecting min and max of the leading edge of the first return pulse. Another helpful measure could be taken from the start of the TX decay until the first rising edge.
 Figure 6-1 TUSS4470 1MHz Water Level
Measurement: Undamped
Figure 6-1 TUSS4470 1MHz Water Level
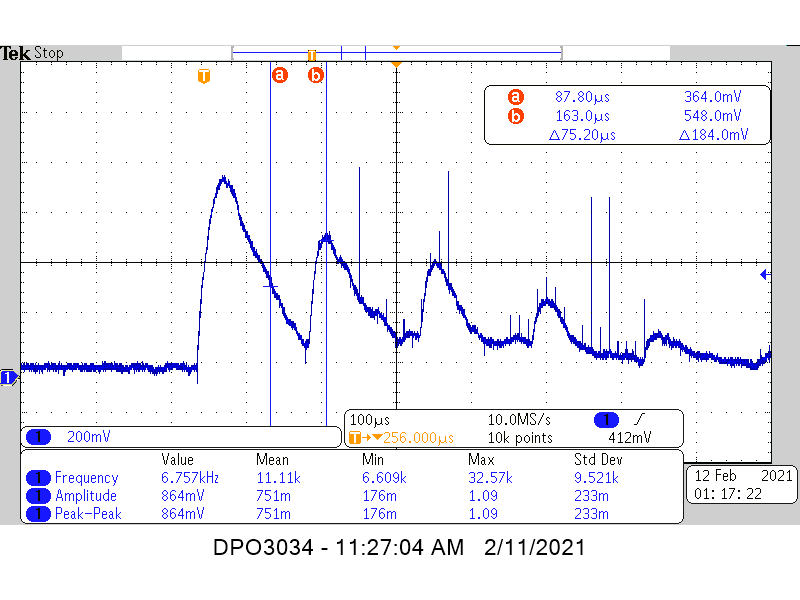
Measurement: UndampedFigure 6-2 shows a 10 kΩ potentiometer soldered in parallel to the transducer across J3 on the TUSS4470EVM provided the adjustable damping resistance.
 Figure 6-2 TUSS4470 1 MHz Water Level
Measurement: 500Ω damping
Figure 6-2 TUSS4470 1 MHz Water Level
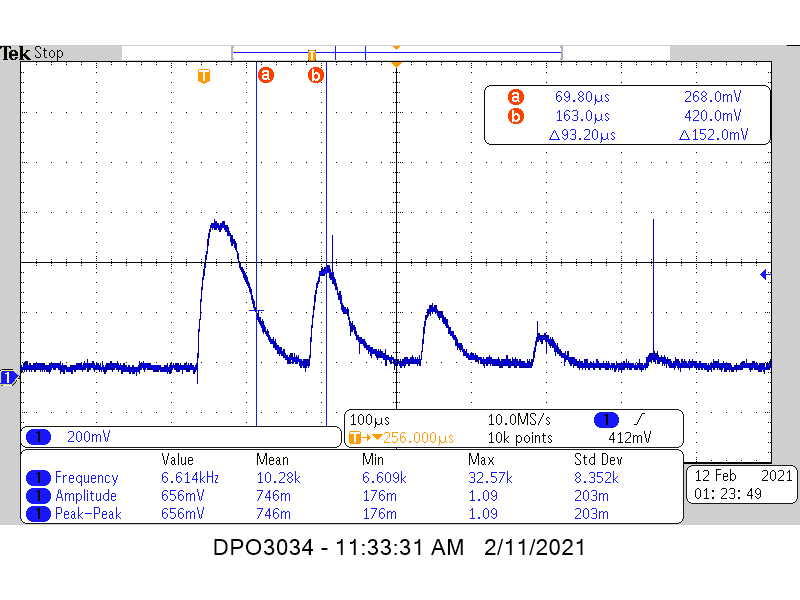
Measurement: 500Ω dampingFigure 6-3 compares the constant ToF measurements, the damped measurements show a quicker decay before the first echo pulse arrives as the resistance is decreased. The timing metric used here also increases from 75.2 μs to 93.2 μs, illustrating that the minimum range will be somewhat improved with resistive damping. The drawbacks to resistive damping are reduced range or increased current consumption from the increased load on the transducer driver.
 Figure 6-3 TUSS4470 1 MHz Water Level
Measurement: 75Ω damping