SLOU553 May 2021
- 1Trademarks
- 2Hardware Overview
-
3Software Overview
- 3.1 PurePath Console 3 (PPC3) Access and Description
- 3.2 PurePath Console 3 – TAS6424E EVM Home Window
- 3.3 PurePath Console 3 – TAS6424E EVM Register Map Window
- 3.4 PurePath Console 3 – TAS6424E EVM Monitor and Control Window
- 3.5 TAS6424E-Q1 EVM Start Up
- 4Board Layouts, Bill of Materials, and Schematic
- 5Revision History
3.5.2 TAS6424E-Q1 Settings on Device Monitor and Control Window
The TAS6424E Register Map window is for reference. Most of the register settings are done on the Device Monitor and Control window
Click on “CONNECT” button on the bottom left corner of the TAS6424E EVM application window, see Figure 3-9. The LED next to the TAS6424E EVM changes from gray to green and the “CONNECT” button changes to “DISCONNECT” button.
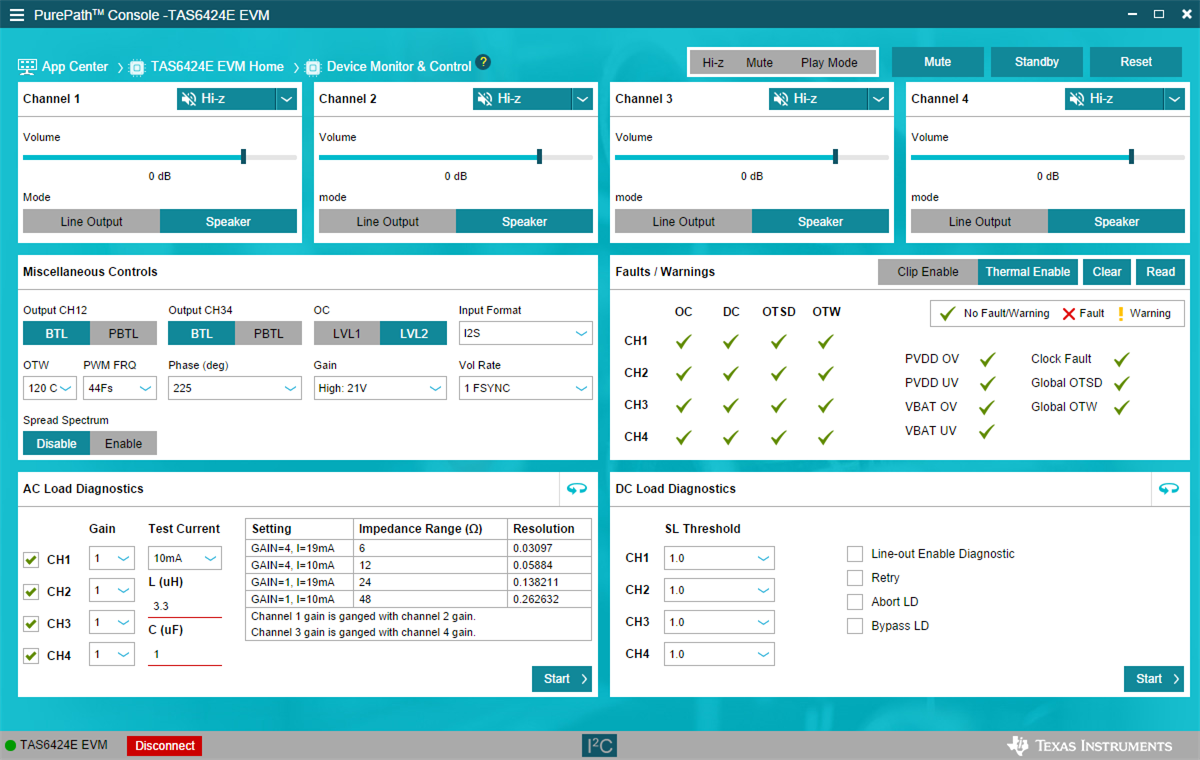
Click on the TAS6424E Device Monitor and Control box. The following window is displayed.
 Figure 3-9 Device Monitor
and Control Window
Figure 3-9 Device Monitor
and Control WindowThis window has 6 major sections: global control section, channel control section, other control section, faults and warnings section, AC load diagnostics section and DC load diagnostics section.