SLUUCH4A October 2021 – October 2023 BQ27Z746 , BQ27Z758
- 1
- Abstract
- Trademarks
- 1 Software Setup
- 2 Troubleshooting Unexpected Dialog Boxes
- 3 Hardware Setup
- 4 Using bqStudio
- 5 Calibrating Gauge Measurements
- 6 Protections
- 7 Chemical ID
- 8 Learning Cycle and Golden Image
- 9 Gauge Communication
- 10BQ27Z746-Based Circuit Module
- 11Circuit Module Physical Layout, Bill of Materials, and Schematic
- Revision History
4.1 Starting the Program
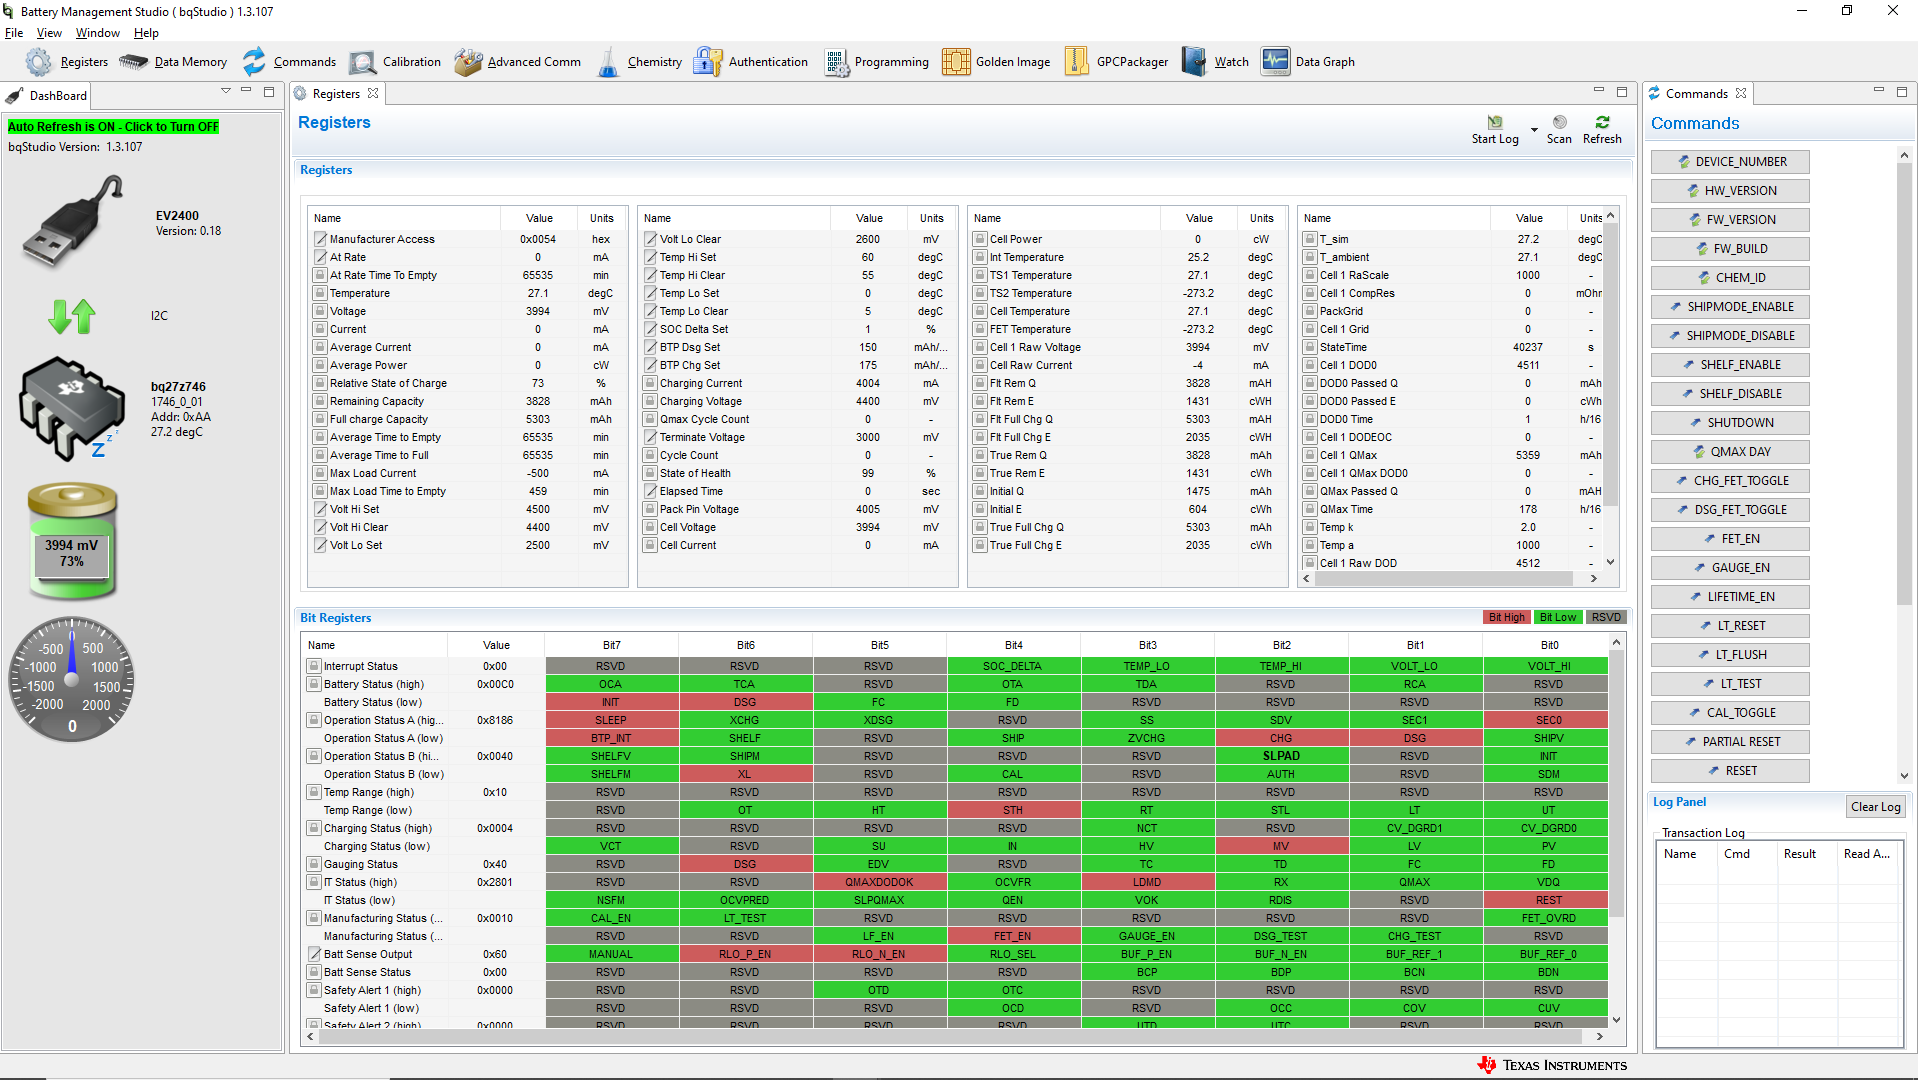
Run bqStudio from the desktop. The window consists of a tools panel at the top, and other child windows that can be hidden, docked in various positions or allowed to float as separate windows. When bqStudio first starts up the Gauge Dashboard window, the Registers window, and Data Memory window should be seen in the main window. Registers, Data Memory, Commands, and other windows can be added to the main window by clicking on the corresponding icon in the tools panel at the top of the main window. Data should appear initially in the Gauge Dashboard, Registers and Data Memory sections. The Refresh (single time scan) or the Scan (continuous scan) buttons can be clicked in order to update the data in the Registers and Data Memory windows. Continuous scan is enabled when the Scan checkbox is highlighted green and disabled when the Scan checkbox is not highlighted. The continuous scanning interval can be set with the stopwatch icon next to the Scan button. When the stopwatch icon is clicked, a drop-down menu appears and the desired scanning interval can be selected. The scan interval value shows up next to the stopwatch icon.
 Figure 4-1 Registers Screen
Figure 5-1 shows the main bqStudio window. Additional Flag and Control Status data can be viewed at the bottom of the registers window.