SLVUC15 March 2021 TPS7H4001-SP
3.1 Frequency Response
- Create a new simulation profile simulation profile by clicking
on PSpice → New Simulation Profile.
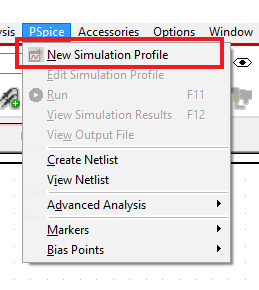
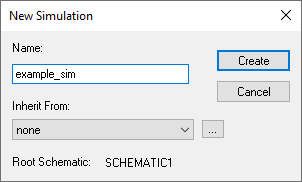
- Name the simulation profile and then click
OK.
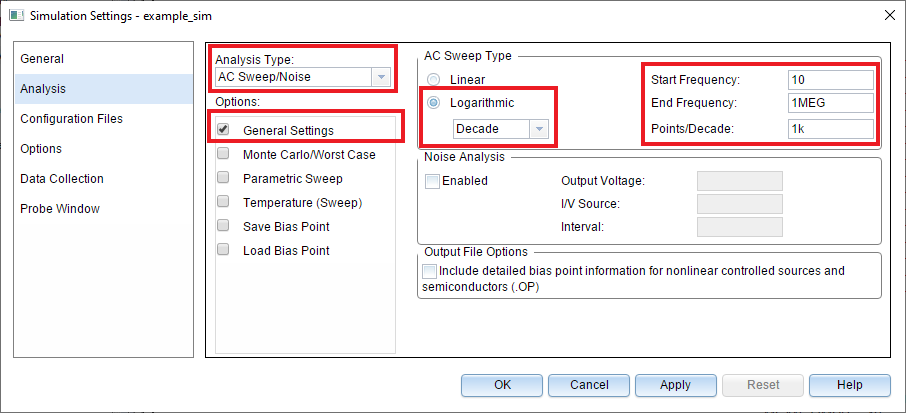
- The bullets below highlight the
parameters that must be filled out in each section of the simulation settings.
The image below shows where the parameters are located and gives an example for
how they can be set.
- Analysis Type
- Select "AC Sweep/Noise"
- General Settings
- Chose the desired start and end frequency
- Set the number of points per decade to determine simulation resolution
- Select the desired sweep type ("Logarithmic" is chosen in the example since a Bode plot will be used to display the simulation results)
- Temperature
(Sweep)
- This section can be used to set the simulation temperature
- Analysis Type
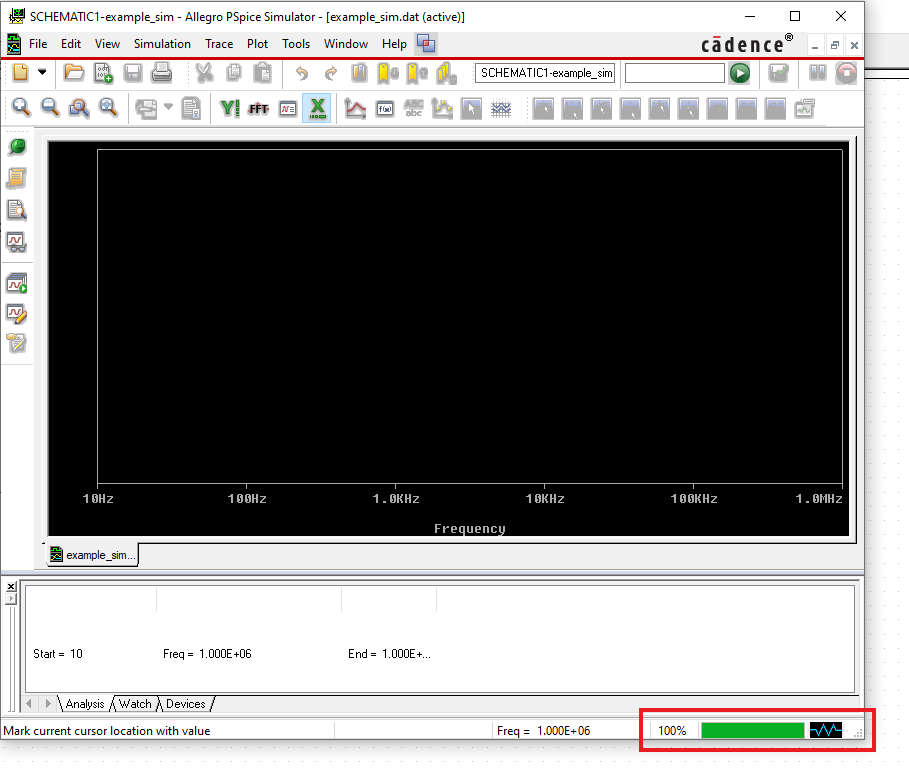
- Once the parameters have been defined, click OK to save and close the simulation settings.
- Run the Simulation by pressing F11 or
selecting Pspice → Run. The simulation window will open and simulation
progress will be shown in the bottom-right corner.
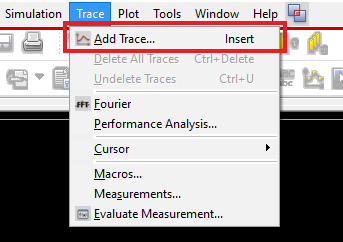
- After the simulation is complete, the frequency response
results can be viewed as a Bode plot by clicking on Trace → Add Trace.
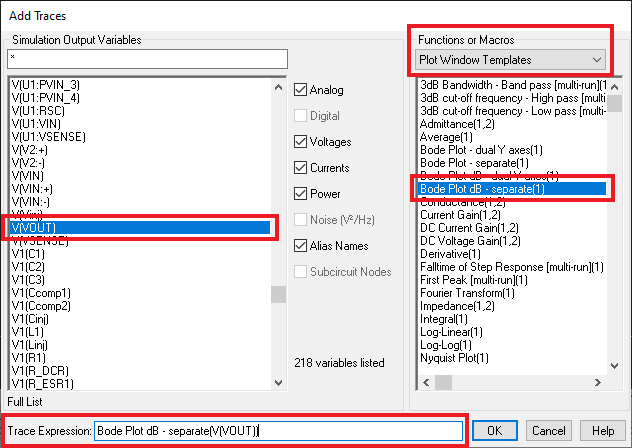
- This
will bring up another window that lists the signals present in the schematic on
the left side and gives options for displaying signals on the right side. Select
the options shown in the image below to display the Bode plot or type the
following expression directly into the Trace Expression field: Bode
Plot dB - separate(V(VOUT))
- Press OK and the Bode plot
will be displayed.
 Figure 3-1 Frequency Response
Bode Plot
Figure 3-1 Frequency Response
Bode Plot