SLVUCR9B August 2023 – January 2024 TPS2HCS10-Q1
3.1.2 I2T Tuner
The I2T Tuner tab allows the user to configure/tune the I2T settings of the high-side switch and visualize the resulting curve versus a custom wire profile. On the I2T Curve sub-tab, the I2T curve of the device can be configured in real-time with a custom provided wire model.
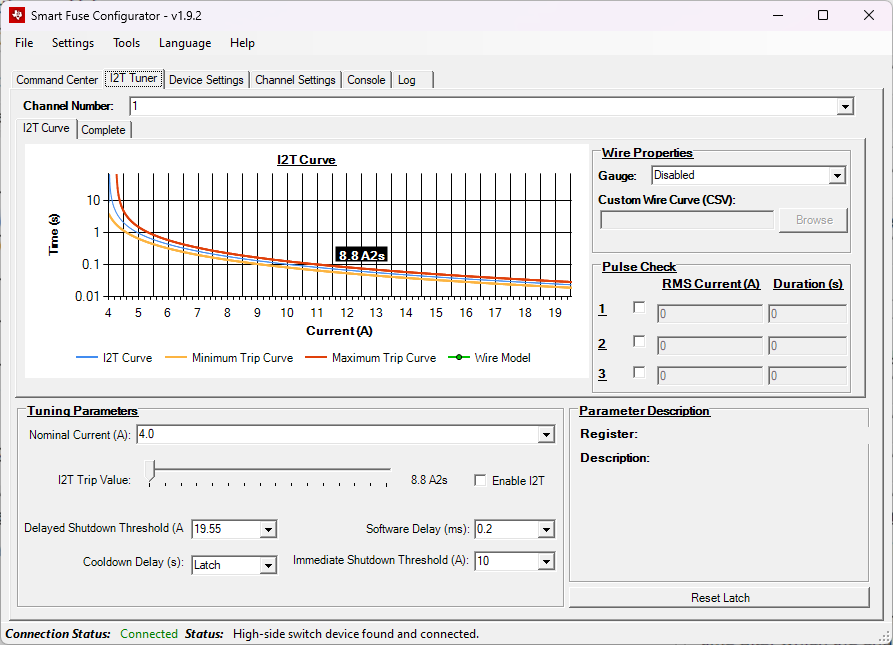 Figure 3-6 I2T Curve Tuner
By adjusting the I2T Trip Value slider, the I2T curve adjusts in real-time on the graph. Note that when the slider is changed, the GUI persists the new value to the device (if auto-persist is enabled, which is by default).
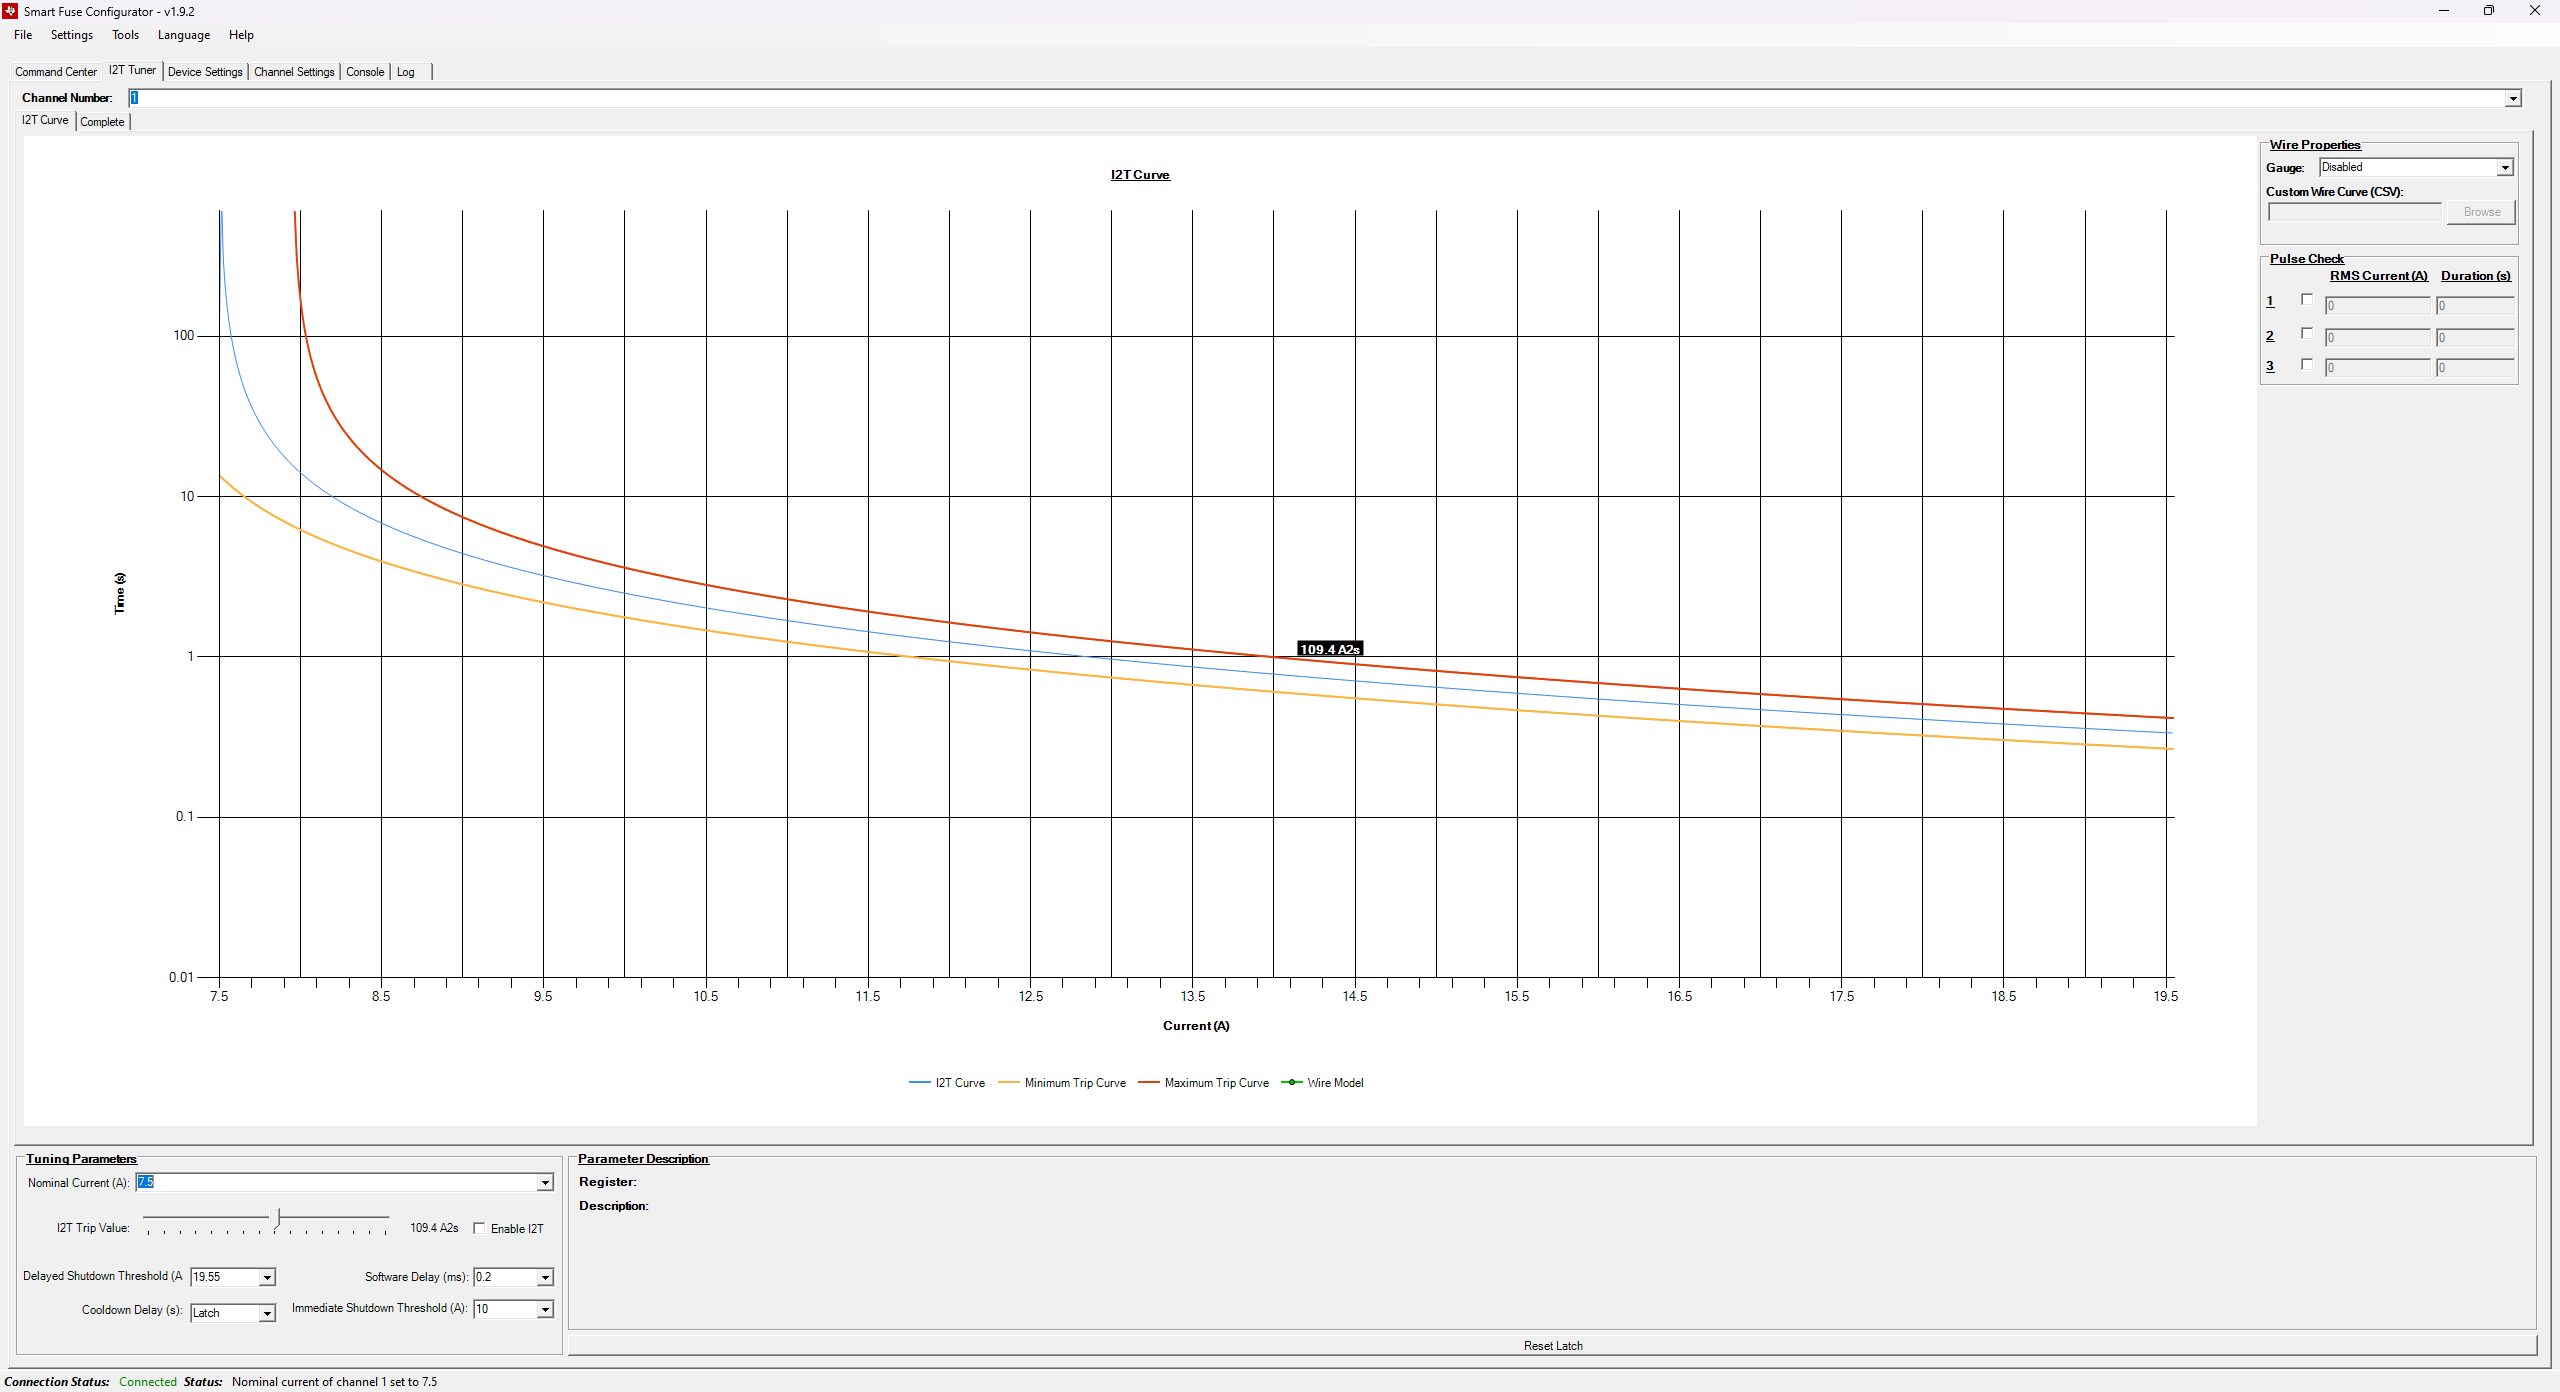 Figure 3-7 Adjusting I2T Trip
Value
Figure 3-7 Adjusting I2T Trip
ValueIn the Wire Properties box, the user has the ability to plot a wire model against the current I2T graph. A couple of different example/dummy models are provided, however the user has the ability to provide a wire model in CSV format. This format is a simple CSV format that contains current and time values. For example, the following CSV file:
Current,Time
5,100
8,80
10,50
13,40
15,30
17,20
18,10
19,5
This results in the following curve being plotted on the I2T graph.
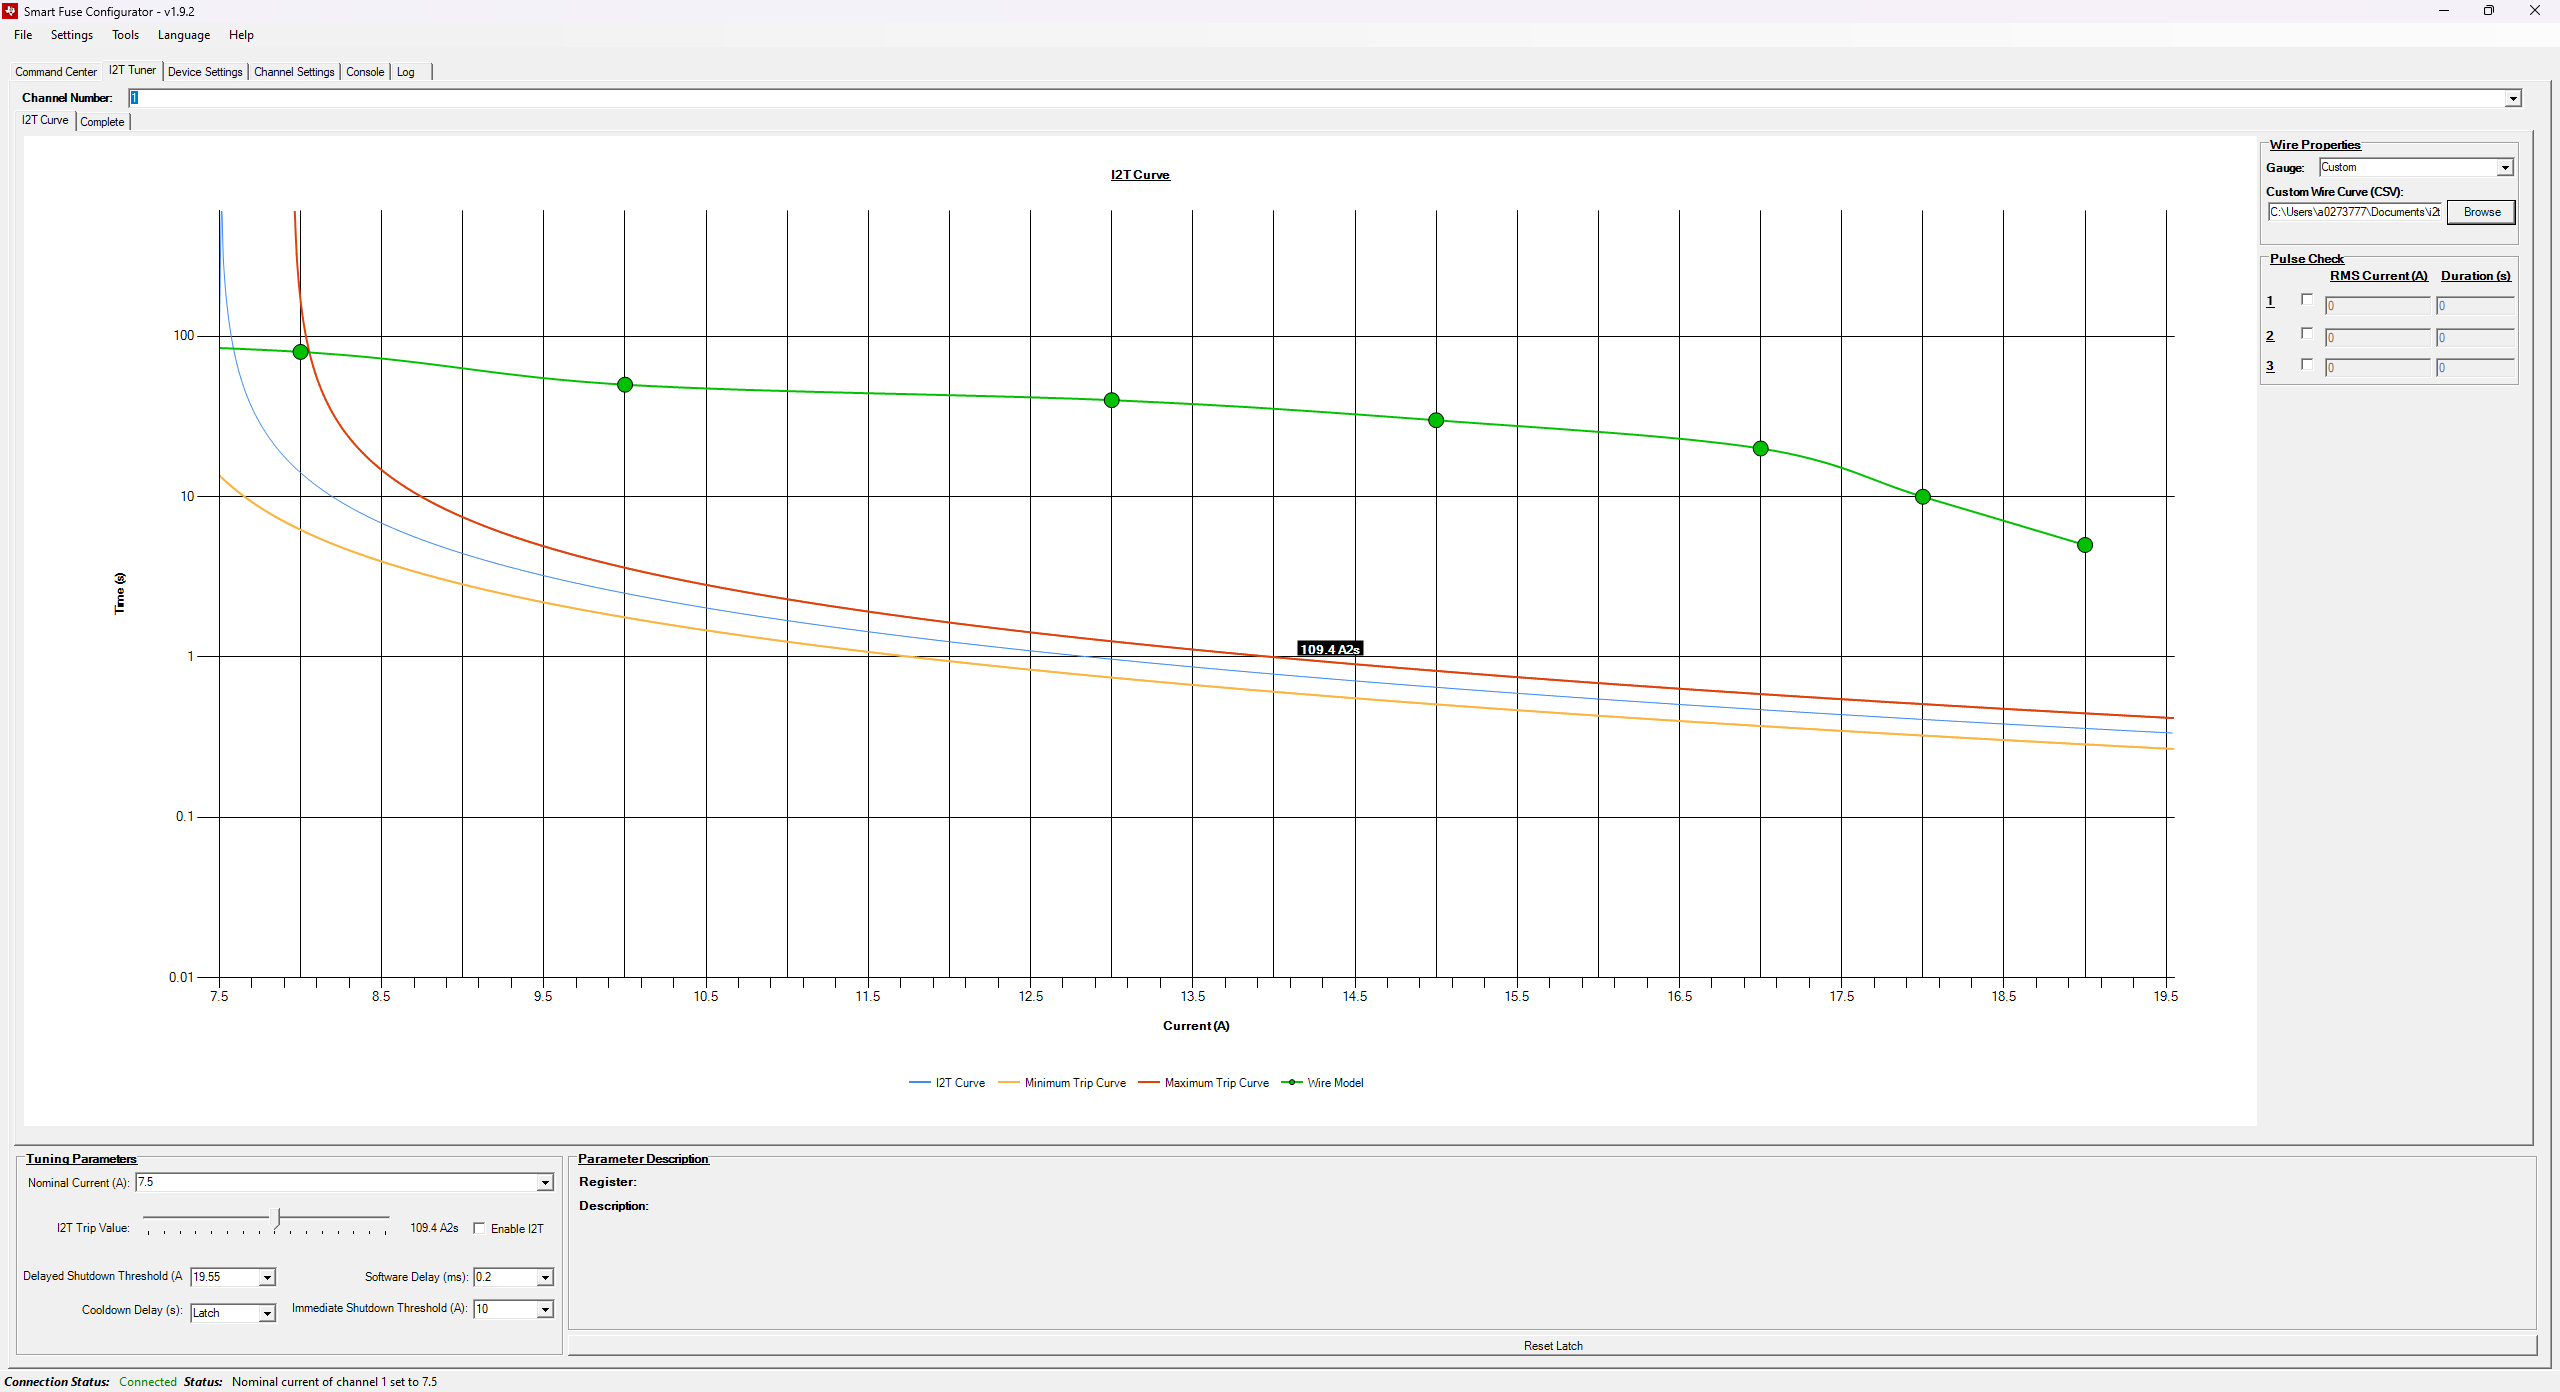 Figure 3-8 Custom Wire Model
The user also has the ability to plot a static DC pulse (RMS current + time) on the graph to determine if a particular I2T setting trips on a transient such as a capacitive inrush event. In the Pulse Check box, enable a pulse and input a current/duration. An example of plotting a static current point can be seen below:
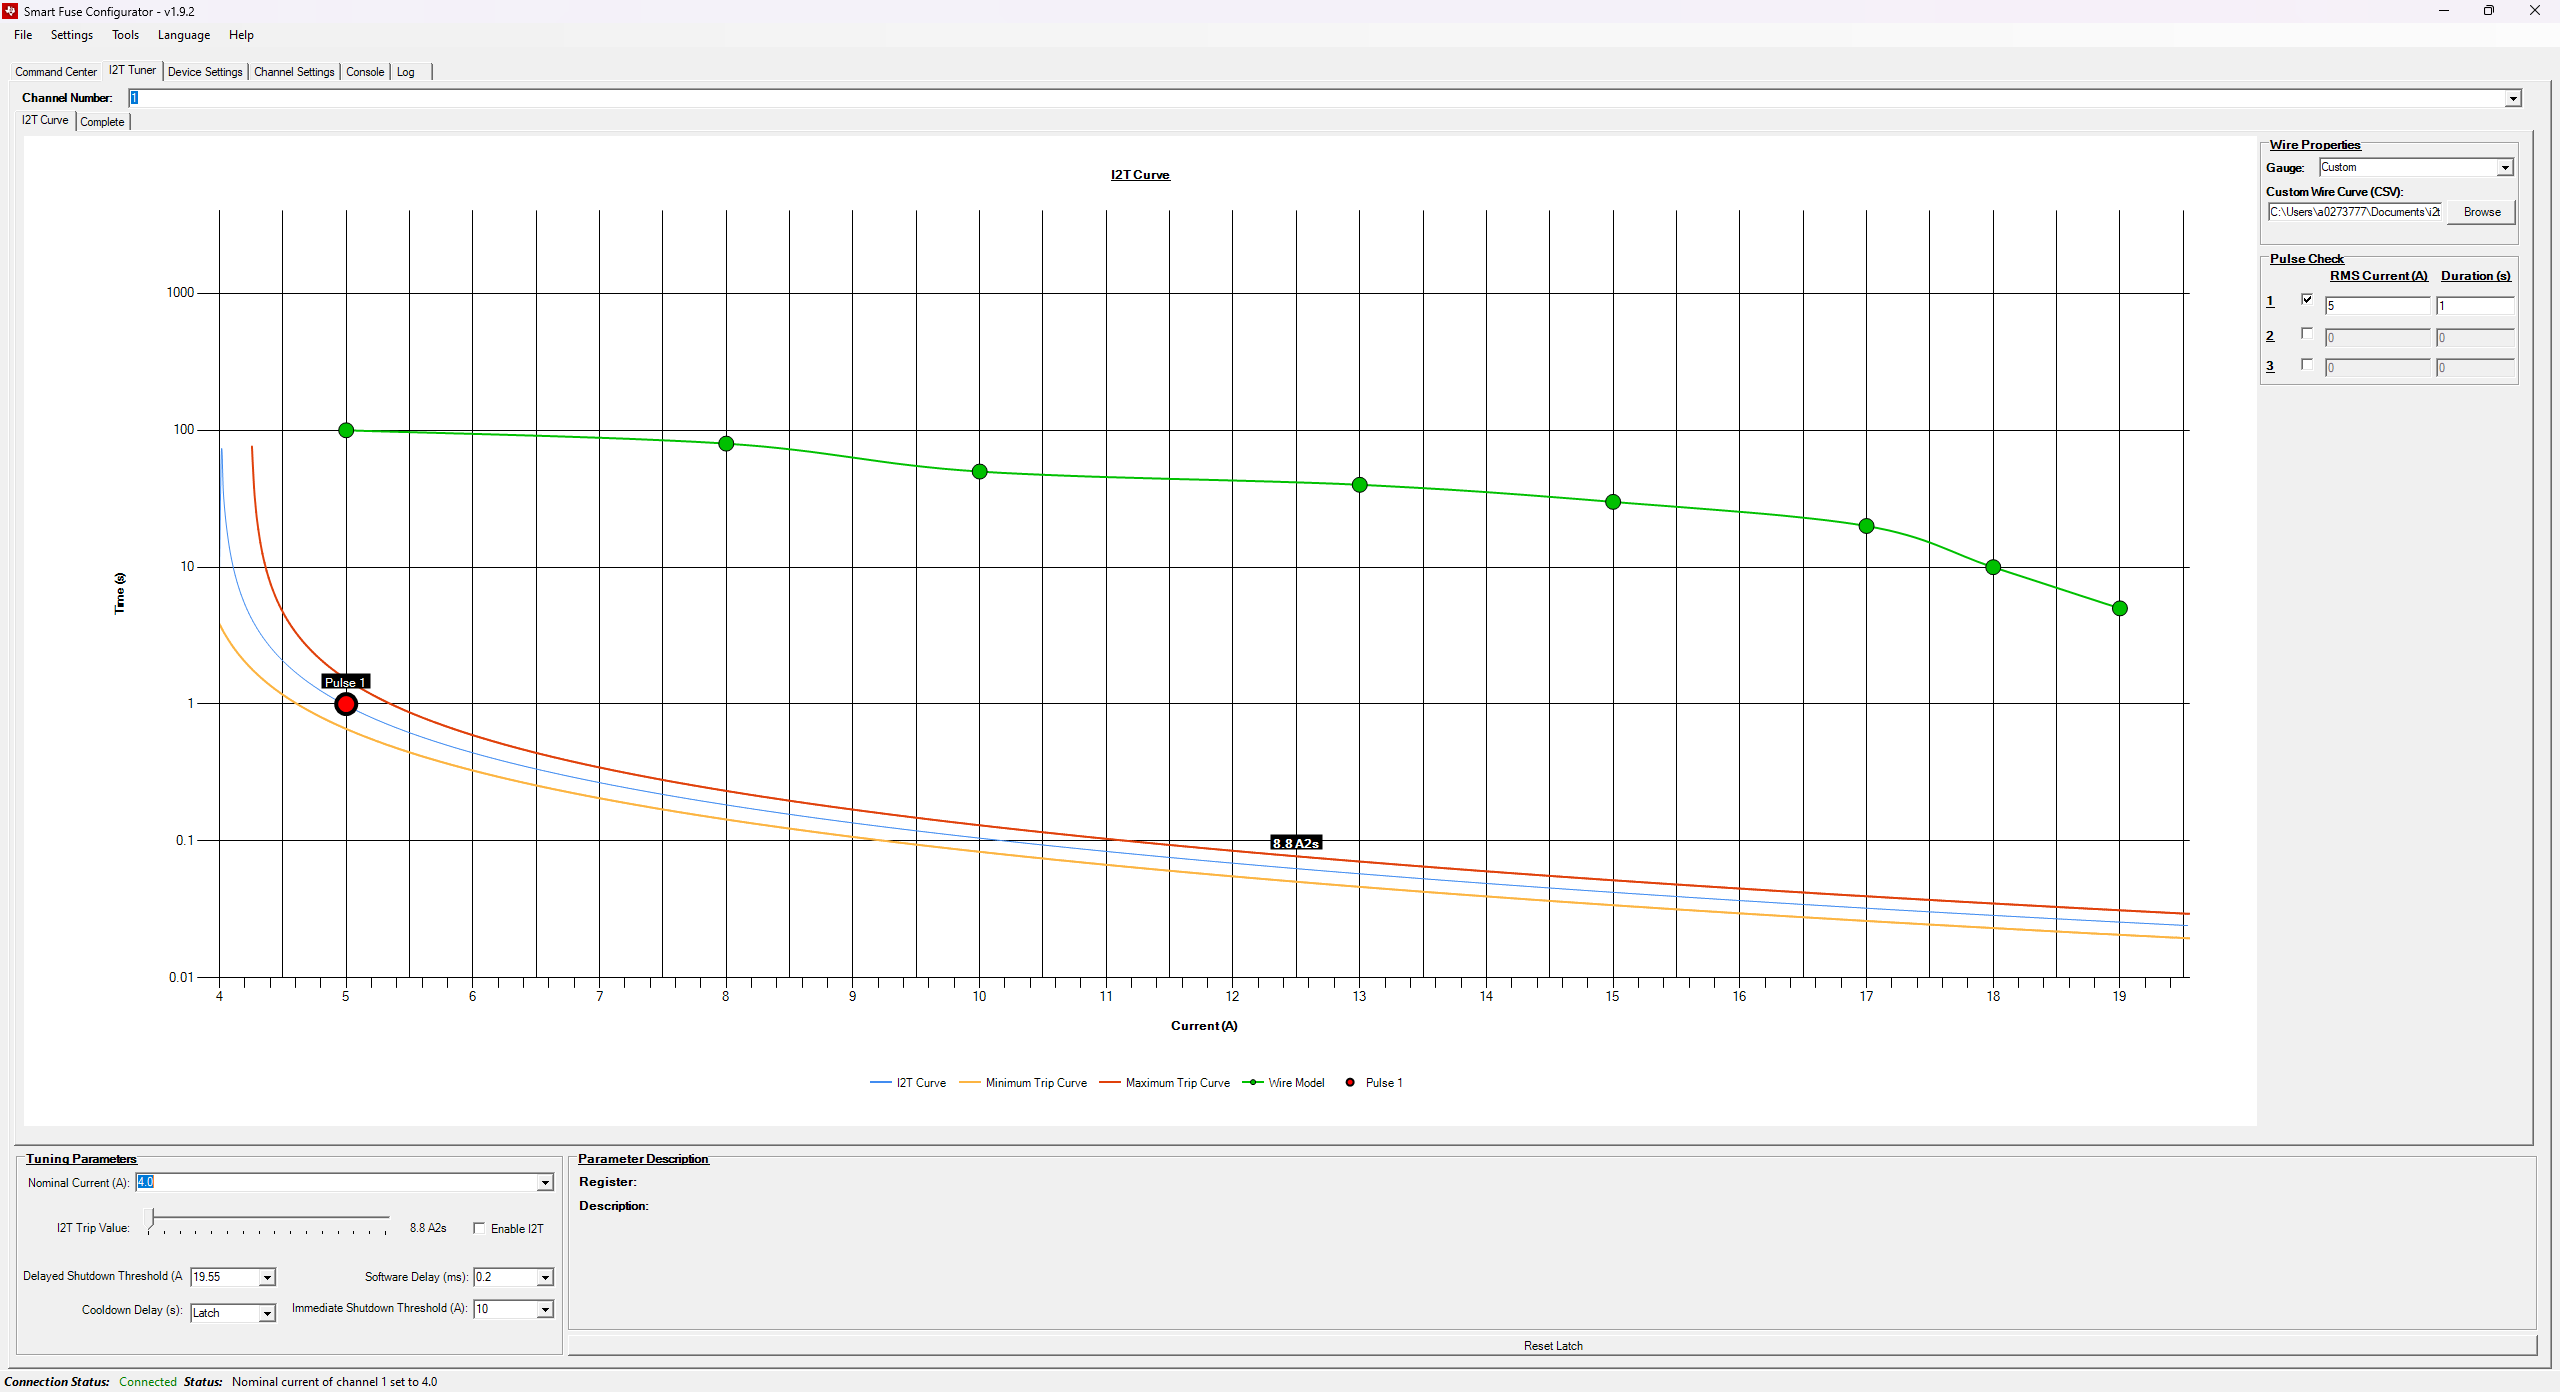 Figure 3-9 Custom Pulse
In the example above, the inputted pulse is below the I2T trip curve signifying that the device does not erroneously trip on the provided transient event.
In the Complete sub-tab, the user can examine the full fuse current profile as described in the data sheet.
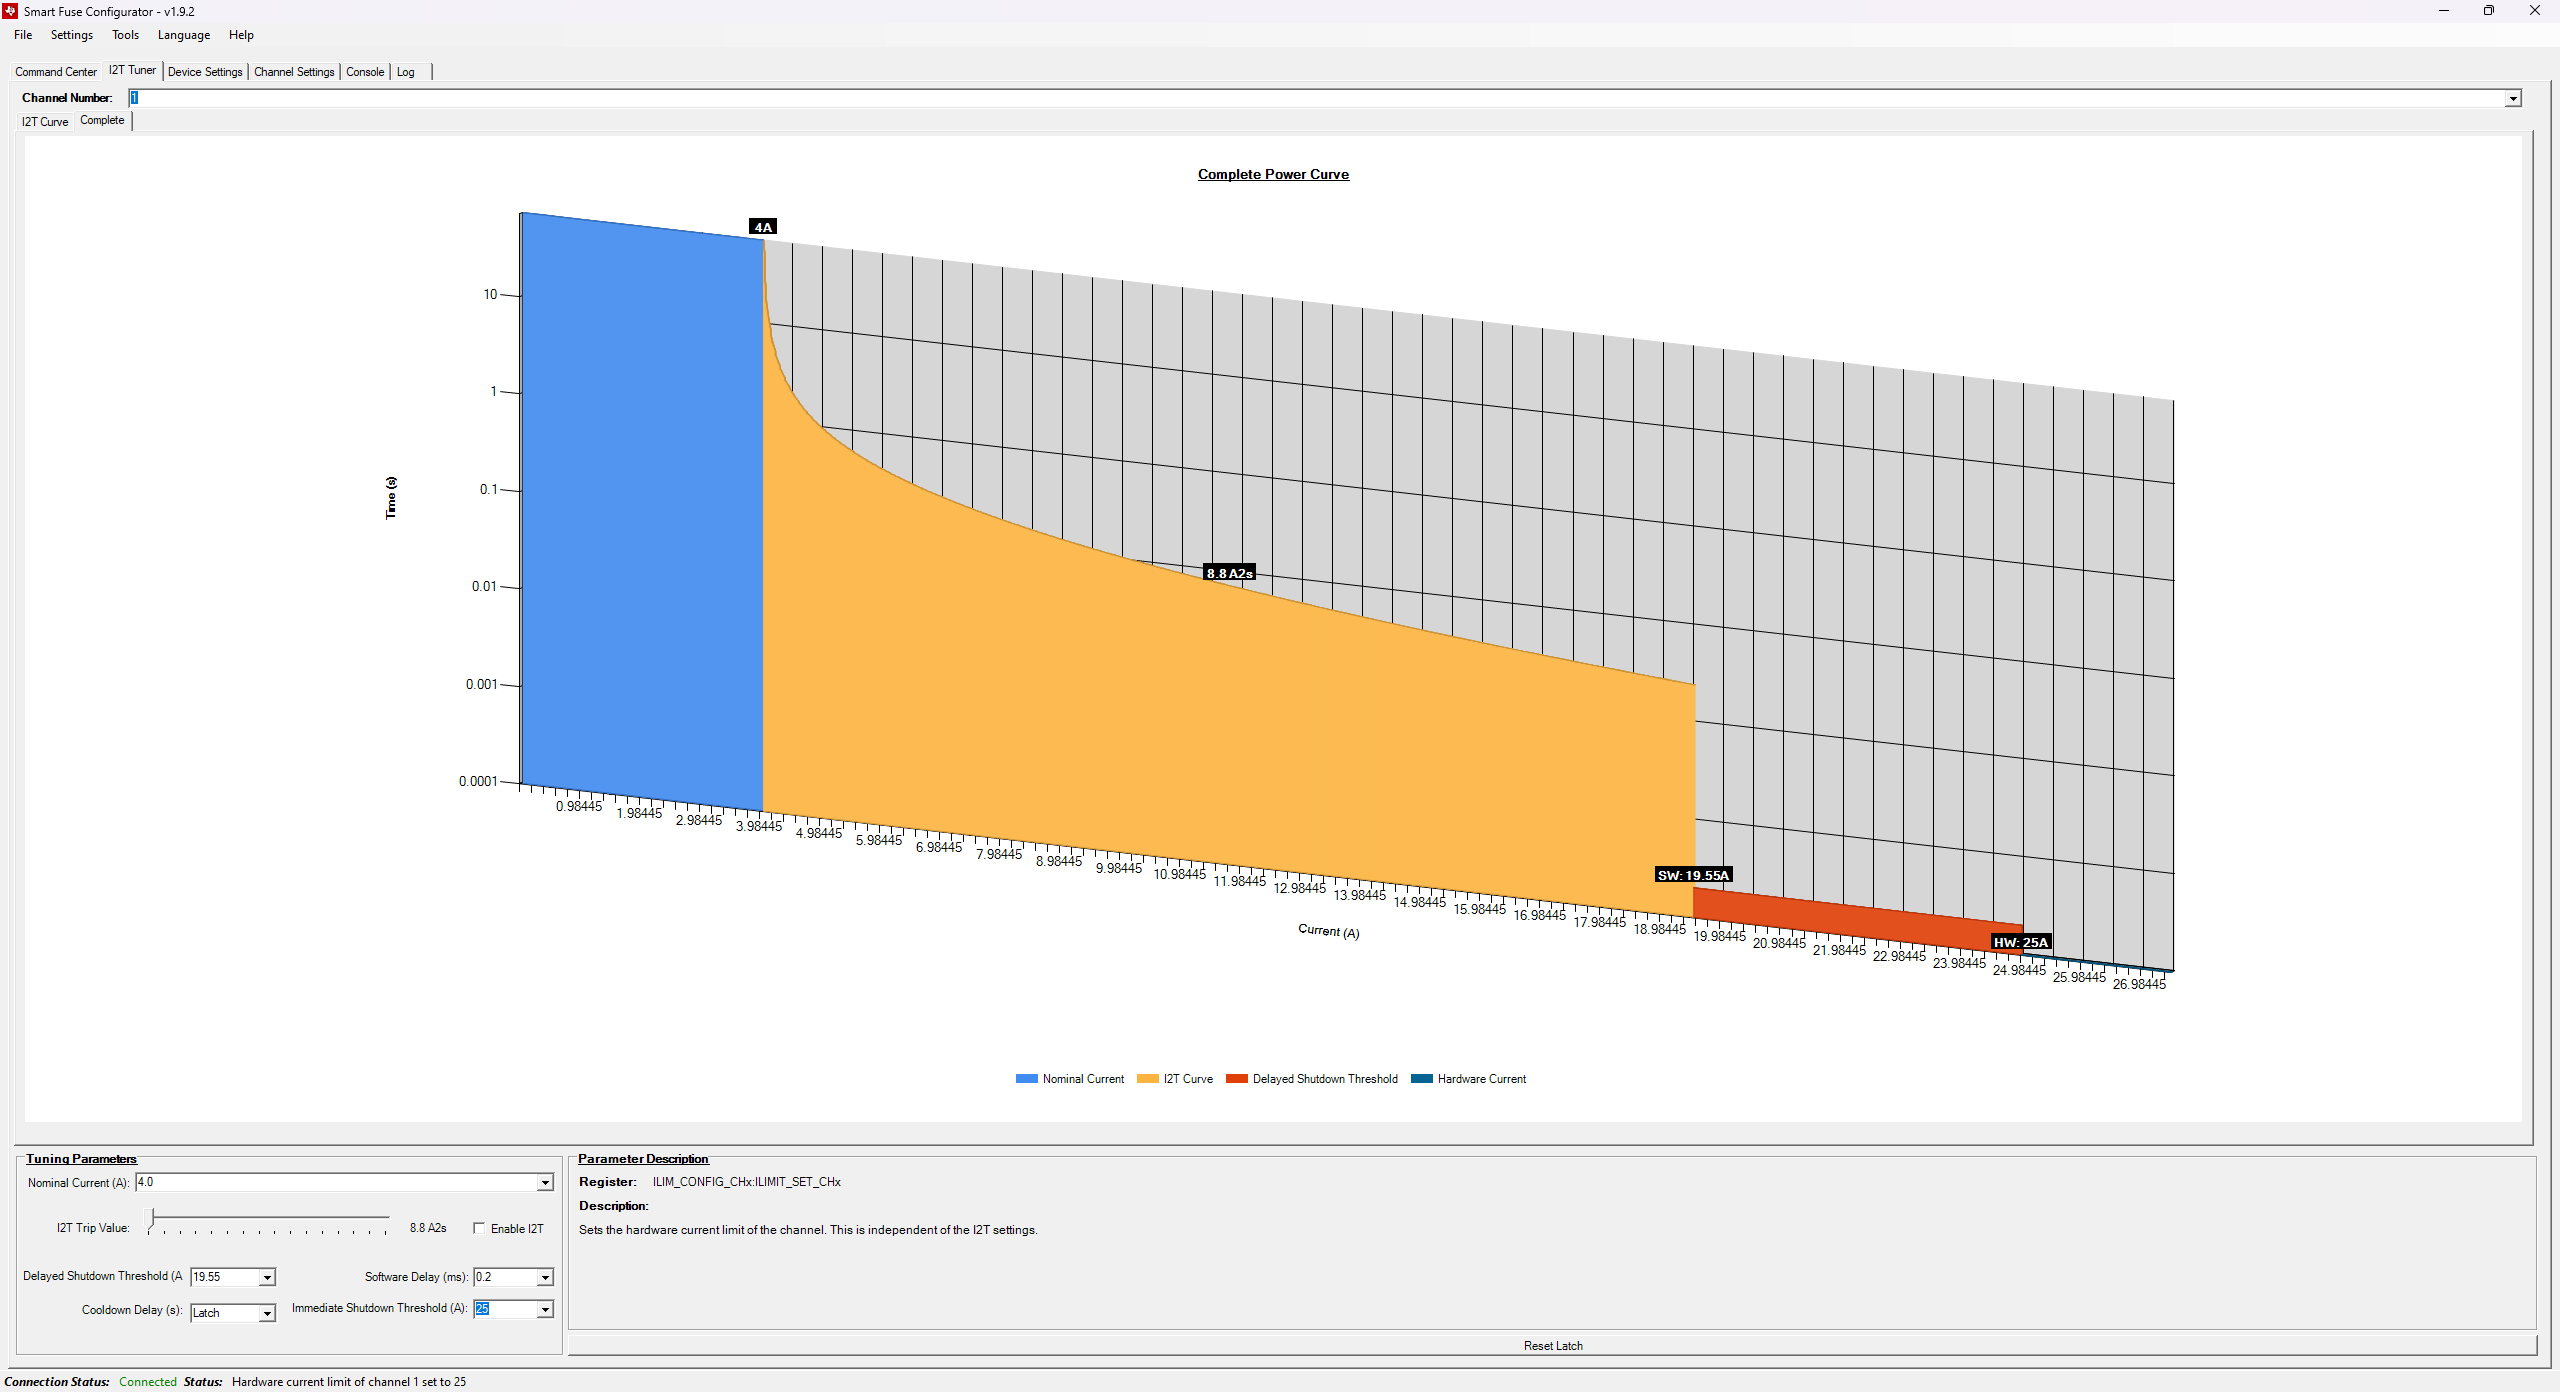 Figure 3-10 Full Current Profile
When any of the controls under the Tuning Parameters box are changed, the graph is updated real-time to show the updated parameters.