SNVAA87 august 2023 LMR38020
2.1 SSR Design Challenges
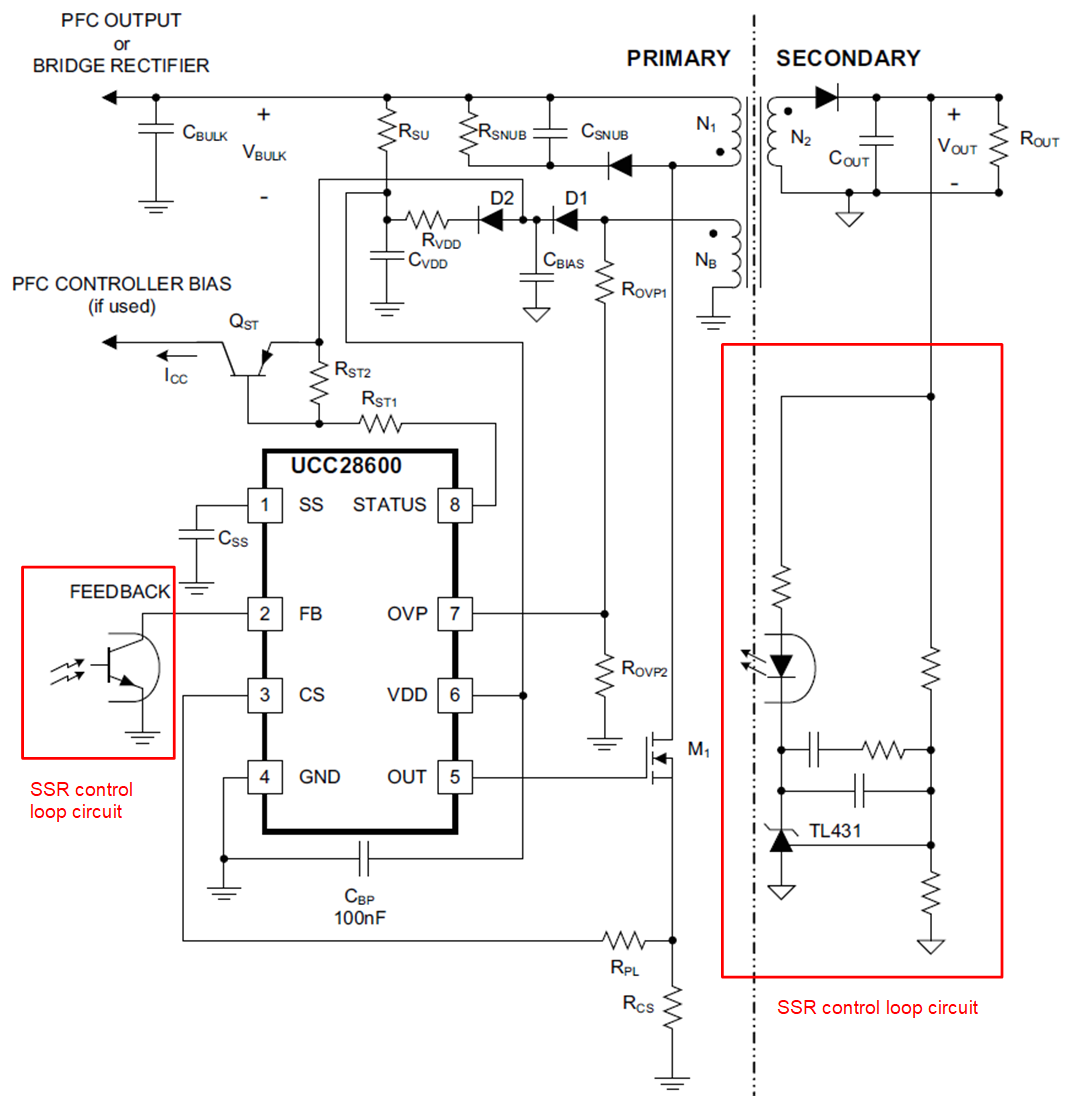
Figure 2-1 shows a typical simplified SSR control schematic. The output voltage is sensed and fed back to the controller through an optocoupler. The optocoupler provides the isolated feedback path without breaking the isolation barrier between the primary and secondary sides. The advantage of SSR is good regulation performance, more accurate output voltage, and there are multiple outputs at the secondary side. This advantage is because cross-regulation between various secondary windings is much better than between the primary and secondary windings.
 Figure 2-1 Simplified SSR Control Schematic
However, SSR control also has some drawbacks that are not negligible in the micro inverter application. As shown in Figure 2-2 SSR control loop requires a lot of components, including an optocoupler and a TL431, along with several resistors and capacitors, to constitute the feedback loop and error-amplifier-compensated circuit, when the voltage is compensated at the secondary side before being sent to the controller placed on the converter’s primary side. This increases the converter’s size and BoM cost.
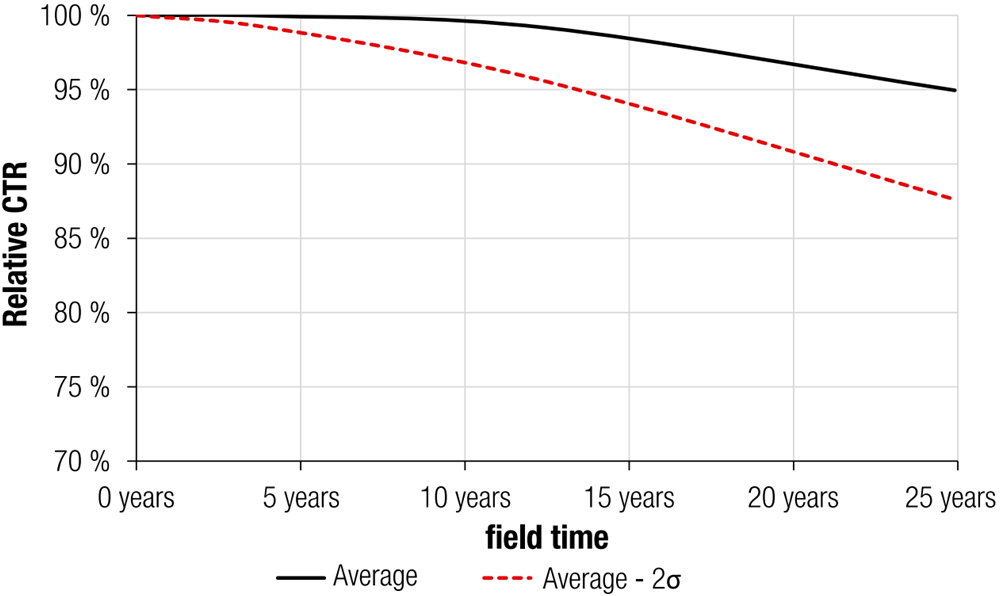
Also, optocoupler has reliability issue due to light attenuation when aging. It may fail completely or degrade in performance with aging time. its Current-Transfer- Ratio (CTR) degrades with aging depending on the operating conditions. The application note Lifetime of Optocouplers from Würth Elektronik Group presents the optocoupler lifetime testing results, as shown in Figure 2-2. The average relative CTRs is given as a solid line and the average - 2σ relative CTRs is given as a dashed line. The 2σ curve shows the lowest expected relative CTR degradation will less than 87% beyond 25 years.
 Figure 2-2 SSR Control Loop Example Circuit Based on UCC28600
 Figure 2-3 Optocouplers Expected CTR Degradation With Field Time