SSZTAU2 september 2016 ADC32RF45
In my previous post, I discussed details of third-order intermodulation (IM3) linearity parameters in active devices. Now let’s apply those techniques and parameters to a real RF-sampling receiver.
The key active components in the lineup are the low-noise amplifier (LNA) and the analog-to-digital converter (ADC). The receiver antenna is “looking at the world” (that is, the entire frequency spectrum). Interference signals picked up by the antenna create intermodulation distortion within the active devices of the receiver that may land within the band of interest. Once the distortion lands in-band, there is no opportunity to filter it out. Filtering the interference signal before it hits critical components is the first line of defense. The second line of defense is to ensure that the active components’ linearity performance is stout enough to handle the interference signals that get through the filtering.
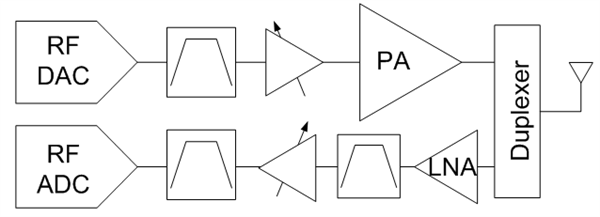
Figure 1 is a block diagram of an RF-sampling transceiver operating in frequency duplex division (FDD) mode. Recall that in FDD mode, the transmitter and receiver operate simultaneously. The transmitter operates at very high powers, in the 10-100W range (40-50dBm). The diplexer filter passes the high-power transmitter signal to the antenna and isolates that signal from the receiver. The diplexer filter is a large cavity filter able to provide sharp selectivity and very low loss. It is also very expensive. One known interference signal is the bleedthrough of the transmitter signal through the filter to the receiver. If the transmitter operates at 40W (46dBm) and the cavity filter provides an impressive 95dB of selectivity, the interference signal at the receiver input is still -49dBm, which is fairly high.
 Figure 1 RF-sampling Transceiver Block
Diagram
Figure 1 RF-sampling Transceiver Block
DiagramA myriad of other unpredictable sources of interference can impact the receiver: other mobile users close to your receiver, competing communication signals or other high-power transmitters. Having one of these sources at the proper frequency, combined with the transmitter bleedthrough, generates an intermodulation distortion product that falls within the band.
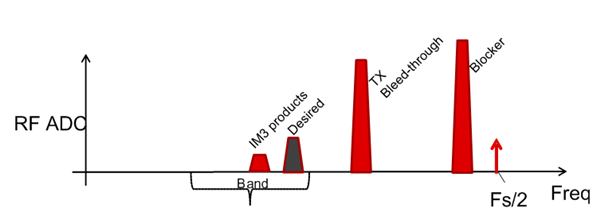
Let’s investigate an example to illustrate the situation. Figure 2 shows the spectrum of a receiver operating in the 1.96GHz UMTS telecom band. The transmit band is located only 60MHz above, centered at 2.14GHz. Some of the transmitter power will seep into the receiver. If a high-power interference signal hits the receiver at around 2.32GHz, then the low-side intermodulation product lands right inside the receiver band. The input filtering is the first line of defense, but it cannot completely eliminate all of the interference. The second line of defense is to ensure that the cascaded linearity performance of the receiver is good enough to pass sensitivity requirements in the presence of blockers.
Similar to the cascade analysis shown in my previous post about noise, adding input intercept point parameters to the lineup analysis shows how the combination of each device in the lineup contributes to overall system performance. Third-order input intercept point (IIP3) is the “yang” to noise figure’s “yin.” With noise figure, higher gain and less loss yield better noise performance. With IIP3, lower gain and more attenuation tend to yield better linearity performance. You must strike the proper balance within the lineup to ensure proper signal reception at the lowest sensitivity level and in the presence of blockers.
 Figure 2 IM3 Distortion Falling within
the Receiver Band
Figure 2 IM3 Distortion Falling within
the Receiver BandEquation 1 calculates the cascaded two-tone IIP3 performance. The “i” element represents the current stage and the “i-1” stage represents the subsequent stage. The “Attn” terms represent any filter selectivity at the adjacent and alternate tone locations.

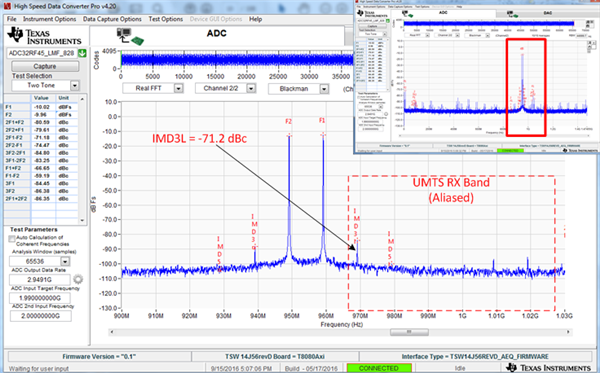
The 14-bit, 3-GSPS ADC32RF45 ADC is an excellent choice for communications systems. As previously discussed, it has a low-noise spectral density output. Just as important, it has high linearity performance. Figure 3 shows one example of a possible interference situation. Two tones are placed just outside the telecom receiver band. The tones create a third-order intermodulation product that lands within the receive band. The tones in this case represent a 10MHz-wide jammer signal just outside the desired receive band. The third-order intermodulation delta (IMD3) parameter reflects the relative power of one fundamental tone to one third-order intermodulation tone. The IMD3 performance in this example is about -71dBc.
 Figure 3 IMD3 Performance with
Interference Tones Just outside the Desired Band
Figure 3 IMD3 Performance with
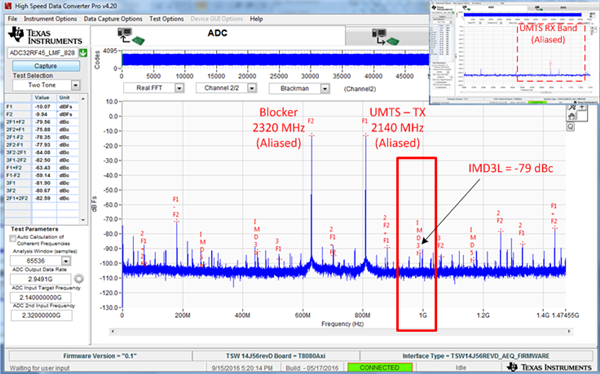
Interference Tones Just outside the Desired BandFigure 4 shows another interference scenario with transmit (TX) bleedthrough at 2.14GHz and jammer at 2.32GHz. The IMD3 performance is about -79dBc. The IIP3 performance calculated from the measured results referenced to a 50Ω system is used in the cascaded lineup analysis. Note that small changes in filtering and gain have a large impact on performance. This is due to the 3-to-1 ratio inherent in third-order intermodulation. Judicious use of attenuation or increased filtering in the proper place makes for a significant improvement in system performance.
 Figure 4 IMD3 Performance with Transmit
Bleedthrough and Blocker Signal
Figure 4 IMD3 Performance with Transmit
Bleedthrough and Blocker SignalCheck back next month, when I will discuss how to use clock phase-noise measurements to analyze RF- sampling data converter performance. Be sure to sign in and subscribe to Analog Wire to get my next post delivered right to your email inbox.
Additional Resources
- Read Jacob Freet’s blog post, “Disentangle RF amplifier specs: intermodulation distortion and intercept points.”
- Download the application report, “ADC32RF45: Amplifier-to-ADC Interface.”
- Learn about TI’s data converter portfolio and explore technical resources.
- Check out reference designs for an RF Sampling S-Band Radar Receiver and a 1-GHz Signal Bandwidth RF Sampling Receiver Solution.
- See all posts in the RF Sampling blog series.