SWRA465A August 2014 – July 2015 CC2530 , CC2530 , CC2530-RF4CE , CC2530-RF4CE , CC2592 , CC2592
- Using CC2592 Front End With CC2530
- A Marker - Delta Method
- Revision History
A.1
- Power Setting: 0xE5
- Set the DUT in Modulated TX
- Center Frequency: 2480 MHz
- Span: 10 MHz
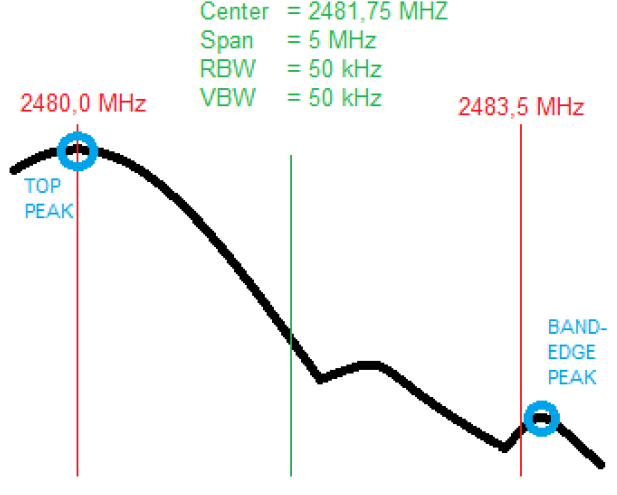
- Choose a spectrum analyzer that encompasses both the peak of the fundamental emission and the band-edge emission under investigation (for example, 2483.5 MHz, edge in Figure 13).
- Record the peak levels of the fundamental emission and the relevant band edge emission. The band edge peak is measured at the highest point to the right of the 2483.5 MHz line, which is typically on this line. However in some cases there may be a higher peak nearby. Observe the stored trace and measure the amplitude delta between the top peak of the fundamental and the peak of the band-edge emission.
- Note a lower RBW, even as low as 30 KHz, may be required to see the band-edge peak.
- When the DELTA value is calculated, use it to check how the PEAK and Average values are compared to their respective limits.
| RBW | VBW | Detector | Meas. Name | Power | Comments |
|---|---|---|---|---|---|
| 1 MHz | 1 MHz | Max Peak + Max Hold | PEAK | 18.9 | |
| 1 MHz | 10 Hz | Average + Max Hold | AVERAGE | 16.6 | The power will be lower for AVERAGE than for PEAK |
 Figure 13. Band-Edge Setup
 | RBW | VBW | Detector | Meas. Name | Power | Comments |
|---|---|---|---|---|---|
| 1% of total span | >= RBW (100 KHz) | Max Peak + Max Hold | TOP PEAK | 13.0 | RBW - never less than 30 kHz. Several sweeps in peak hold mode |
| 1% of total span | >= RBW (100 KHz) | Max Peak + Max Hold | Band-Edge PEAK | -33.0 | RBW - never less than 30 kHz. Several sweeps in peak hold mode |
| TOP PEAK - Band Edge PEAK -> | DELTA | 46.0 | Delta will normally be > 40dB | ||
| Math | Power (dBm) | Limits/Comments |
|---|---|---|
| PEAK - DELTA = | -27.1 | –21.2 dBm (74 dBuV/m) |
| AVERAGE - DELTA = | -29.4 | –41.2 dBm (54 dBuV/m) |
| BACK OFF = | (-29.4) - (-41.2) = 11.8 | Required back off on channel 26 |