SWRA725 November 2021 AWR2944 , IWR2944
3.1 Interference Statistics
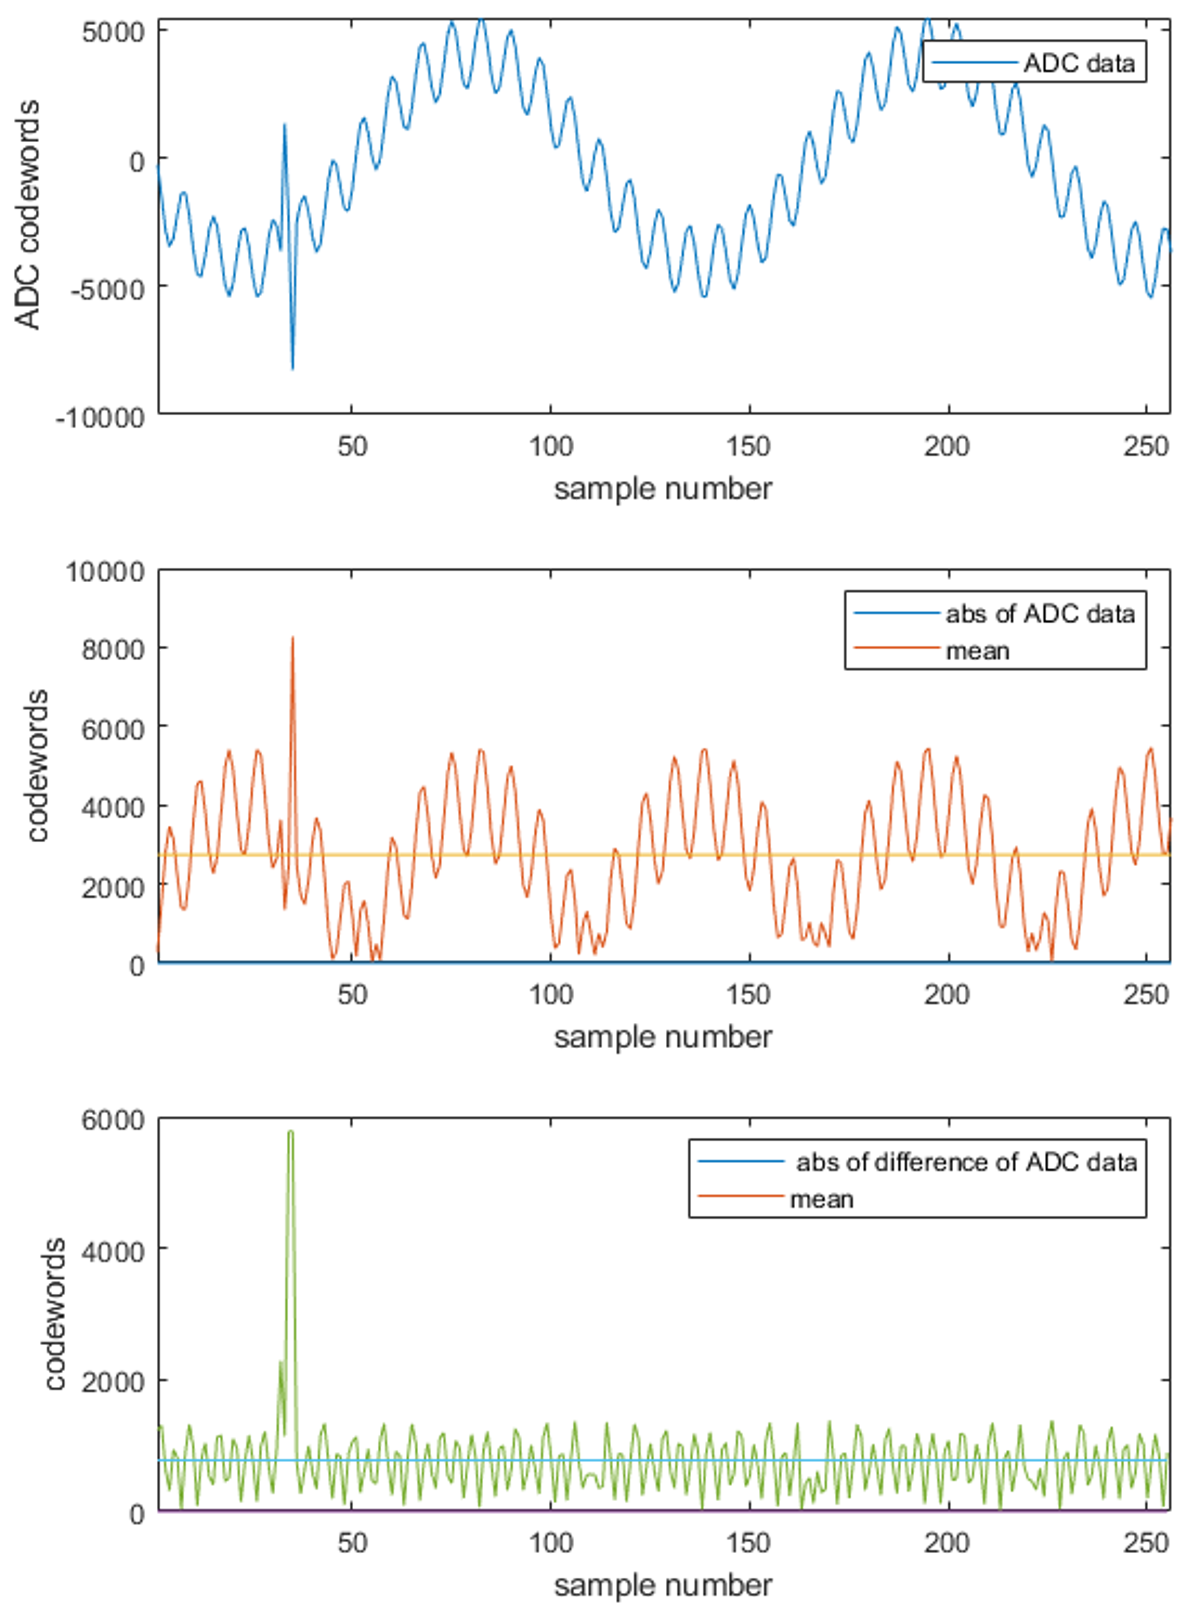
Two kinds of statistics are computed on the ADC data [2]. These are:
- The sum of absolute values of the adc data, where xi corresponds to the adc samples in the chirp.
- The sum of the first difference of adc data, .
These are then scaled down to generate means, and then scaled up to generate two thresholds (AbsThreshold and AbsDiffThreshold).

The abs-diff filters suppress
the low-frequency tone and help make the glitch more visible.
Figure 3-3 Detecting Outliers Using Abs
and Abs-diff FiltersThe advantage of calculating the first difference is that it suppresses low-frequency reflections like the bumper reflection or the antenna coupling effect, allowing weaker glitches to be easily found.