SLAA732A February 2017 – April 2021 PGA460 , PGA460-Q1
4.4.1 Impedance Gain-Phase Analyzer
An impedance gain-phase analyzer is an instrument that allows a frequency of the transducer to be swept and plotted against impedance (Ω) and phase (°). An example instrument is the HP 4194A impedance gain-phase analyzer. The equivalent circuit of the transducer can be extracted using these plots when fitted with a Butterworth-Van Dyke (BVD) model. BVD parameter fitting is a built-in function on some analyzers, or can be fitted using a numerical computing environment such as MATLAB.
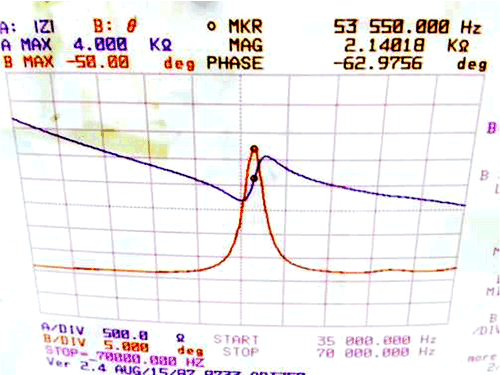
The example in Figure 4-3 shows the analyzer plot of a transducer swept from 35 kHz to 70 kHz. The peak in the phase angle (red) indicates the resonant center-frequency of the transducer. The impedance (purple) corresponds to the reactive components or the inductive and capacitive properties of the transducer. At resonance, the current and voltage are in phase, resulting in a 0° phase angle which is observed as the mid-point of the rising impedance slope.
 Figure 4-3 Impedance Gain Phase Plot of Transducer Using Analyzer