SBOS936E November   2019  – August 2022 OPA182 , OPA2182 , OPA4182

PRODMIX  

  1. Features
  2. Applications
  3. Description
  4. Revision History
  5. Device Comparison Table
  6. Pin Configuration and Functions
  7. Specifications
    1. 7.1 Absolute Maximum Ratings
    2. 7.2 ESD Ratings
    3. 7.3 Recommended Operating Conditions
    4. 7.4 Thermal Information: OPA182
    5. 7.5 Thermal Information: OPA2182
    6. 7.6 Thermal Information: OPA4182
    7. 7.7 Electrical Characteristics
    8. 7.8 Typical Characteristics
  8. Detailed Description
    1. 8.1 Overview
    2. 8.2 Functional Block Diagram
    3. 8.3 Feature Description
      1. 8.3.1 Phase-Reversal Protection
      2. 8.3.2 Input Bias Current Clock Feedthrough
      3. 8.3.3 EMI Rejection
      4. 8.3.4 Electrical Overstress
      5. 8.3.5 MUX-Friendly Inputs
    4. 8.4 Device Functional Modes
  9. Application and Implementation
    1. 9.1 Application Information
    2. 9.2 Typical Applications
      1. 9.2.1 Strain Gauge Analog Linearization
        1. 9.2.1.1 Design Requirements
        2. 9.2.1.2 Detailed Design Procedure
        3. 9.2.1.3 Application Curves
      2. 9.2.2 Rogowski Coil Integrator
      3. 9.2.3 System Examples
        1. 9.2.3.1 24-Bit, Delta-Sigma, Differential Load Cell or Strain Gauge Sensor Signal Conditioning
      4. 9.2.4 Programmable Power Supply
      5. 9.2.5 RTD Amplifier With Linearization
    3. 9.3 Power Supply Recommendations
    4. 9.4 Layout
      1. 9.4.1 Layout Guidelines
      2. 9.4.2 Layout Example
  10. 10Device and Documentation Support
    1. 10.1 Device Support
      1. 10.1.1 Development Support
        1. 10.1.1.1 PSpice® for TI
        2. 10.1.1.2 TINA-TI™ Simulation Software (Free Download)
        3. 10.1.1.3 TI Reference Designs
    2. 10.2 Documentation Support
      1. 10.2.1 Related Documentation
    3. 10.3 Receiving Notification of Documentation Updates
    4. 10.4 Support Resources
    5. 10.5 Trademarks
    6. 10.6 Electrostatic Discharge Caution
    7. 10.7 Glossary
  11. 11Mechanical, Packaging, and Orderable Information

Package Options

Mechanical Data (Package|Pins)
Thermal pad, mechanical data (Package|Pins)
Orderable Information

Detailed Design Procedure

The bridge sensor signal flow model is shown in Figure 9-2.
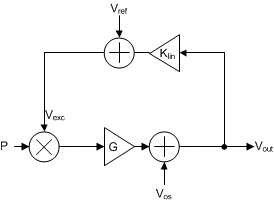
GUID-2D2A81E7-642C-45D4-BD8A-2339B8225276-low.pngFigure 9-2 Bridge Sensor Signal Flow Model

The bridge sensor is modeled as a multiplier, with inputs from an excitation voltage and pressure sensor producing an output voltage given in Equation 1:

Equation 1. GUID-D215FB7F-FFCC-40ED-A0CF-913B5C3C9B7B-low.gif

Kp is the sensitivity of the bridge sensor, and is usually specified in mV/V. P represents the pressure relative to the range of the sensor, normalized to a scale from 0 to 1. Solving this equation with the variables given in the signal flow model and solving for Vout results in Equation 2:

Equation 2. GUID-B5BE009C-5F68-4A4B-BF8D-A21161CDA151-low.gif

This equation has three variables, VOS, G and Klin, that require three equations to solve. To solve these equations. values of Kp at no load, midscale and full load conditions are needed for the sensor. With these values, the system can be linearized.

With known values for Kp, Klin is calculated as shown in Equation 3:

Equation 3. GUID-9E000C96-A21A-4F0C-A2DB-66B3EE487893-low.gif

In this equation, Bv represents the bridge nonlinearity, which is calculated as shown in Equation 4:

Equation 4. GUID-FB6309C4-991B-4980-BE8D-7406403CF01D-low.gif

Bv is solved based on the sensor specifications, and the equation is then used to solve for Klin. Next, the system gain is calculated using Equation 5 and Equation 6.

Equation 5. GUID-905BFBCD-274F-44BC-A9FE-27DEF57AF0A1-low.gif
Equation 6. GUID-094FEDEB-2830-4688-837C-86FAB4761862-low.gif

Solving for VOS in both equations and combining results in Equation 7.

Equation 7. GUID-68EBC831-7545-4DCB-9985-202883E7ABAF-low.gif

Solving for G gives Equation 8.

Equation 8. GUID-75DF601D-5730-4215-B158-D00F682A559B-low.gif

With both Klin and G now calculated, VOS is solved as shown in Equation 9.

Equation 9. GUID-2F2AE55D-46DA-4463-BB58-E3690149CFFB-low.gif

For a sensor with a KP of 0.0003 mV/V at no load, 0.0017 mV/V midscale and 0.00289 mV/V, the corresponding nonlinearity is approximately 4%. Solving for Klin, G, and VOS gives the values shown in Table 9-1.

Table 9-1 Example Bridge Calculations
Klin0.173913
G323.8178
VOS-0.48573