JAJU617A October 2018 – May 2022
- 概要
- Resources
- 特長
- アプリケーション
- 5
- 1System Description
- 2System Overview
- 3Hardware, Software, Testing Requirements, and Test Results
- 4Design Files
- 5Software Files
- 6Related Documentation
- 7Terminology
- 8Revision History
2.4.2.1 Etendue Efficiency Match
The main way to increase lumens out of an LED is to increase the emission area. However, more lumens out of the LED do not necessarily produce more lumens out of a PGU. Due to the optical property of Etendue, there is a limit to how much of the emitting area matches to the collection angle of the DMD illumination path. As the LED die size increases, there is a point of diminishing returns where the luminous output of the LED cannot be captured (and reflected) by the DMD.
Etendue is defined by optical surfaces’ area and emission/collection angle. When calculating the etendue match between two optical components, the Abbe Sine Invariant equation can be used.
 Figure 2-6 Abbe Sine Invariant Component Diagram
With the DLP3030-Q1 DMD, the area is fixed (6.6 × 3.7 mm2), and the illumination angle is also fixed at a 12° tilt. Any incoming light that cannot be captured on this array area at a 12° cone is lost. (To optimize the optical design and take advantage 12° tilt, f/2.4 is typically used, however the f/# can be varied to optimize brightness and contrast. f/2.4 is assumed for the following calculations.) For more information, see Section 2.4.2.2
Analogous to the 12° illumination angle of a DMD, LEDs and their collimating lenses have a collection angle. In a traditional LED-illuminated DLP system, this collection angle is roughly 80°. With a fixed angle, the only remaining variable in Equation 1 is the LED emission area. Refer to Equation 2 and Equation 3 for a calculation of the ideal LED array size.
Equation 2 and Equation 3 show that the best etendue match for the DLP3030 DMD is an LED with w = 1.38 mm and h = 0.785 mm. Any device which is larger in either dimension will be over-sized and result in unused light.
In a system in which power efficiency is optimized, an LED is selected which is either a perfect etendue match or under-sized. This assures that all of the light which is captured by the collection lenses of the LEDs is within the illumination cone of the DMD and reflected into the projection path. An oversized LED wastes light, resulting in inefficiencies and adding unused power.
The two most popular LED parts for the 0.3” DLP3030-Q1 in a RGB display application are from Osram: Q8WP and CSL series. From their data sheet, here are the dimensions of each part’s array:
| Width (mm) | Height (mm) | |
|---|---|---|
| Q8WP | 1.5 | 1.2 |
| CSL | 1 | 1 |
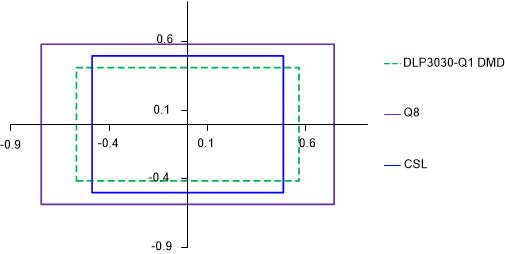
An Etendue Diagram can be used to visually show the match of each LED with a set DMD. In the diagram below, the etendue size of the DLP3030-Q1 DMD, Q8WP LED, and CSL LED is shown. The dimensions were calculated using the Abbe Sine Invariant equation.
 Figure 2-7 Etendue Diagram of 0.3" DMD With Different
LEDs at f/2.4 Aperture
Figure 2-7 Etendue Diagram of 0.3" DMD With Different
LEDs at f/2.4 ApertureFigure 2-7 shows that while the Q8WP and CSL LEDs both have unused light outside the DMD, the CSL LED is much more efficient, with 85% etendue efficiency compared to the Q8WP’s 65% efficiency. In order to increase this efficiency, the optics design can open up the aperture, or use a smaller f/#. The advantages and tradeoffs of changing the aperture are discussed in Section 2.4.2.2.