SBAA598 September 2023 AMC1300 , AMC1300B-Q1 , AMC1301 , AMC1301-Q1 , AMC1302 , AMC1302-Q1 , AMC1311 , AMC1350 , AMC1351
2.2 Simulation in TINA-TI
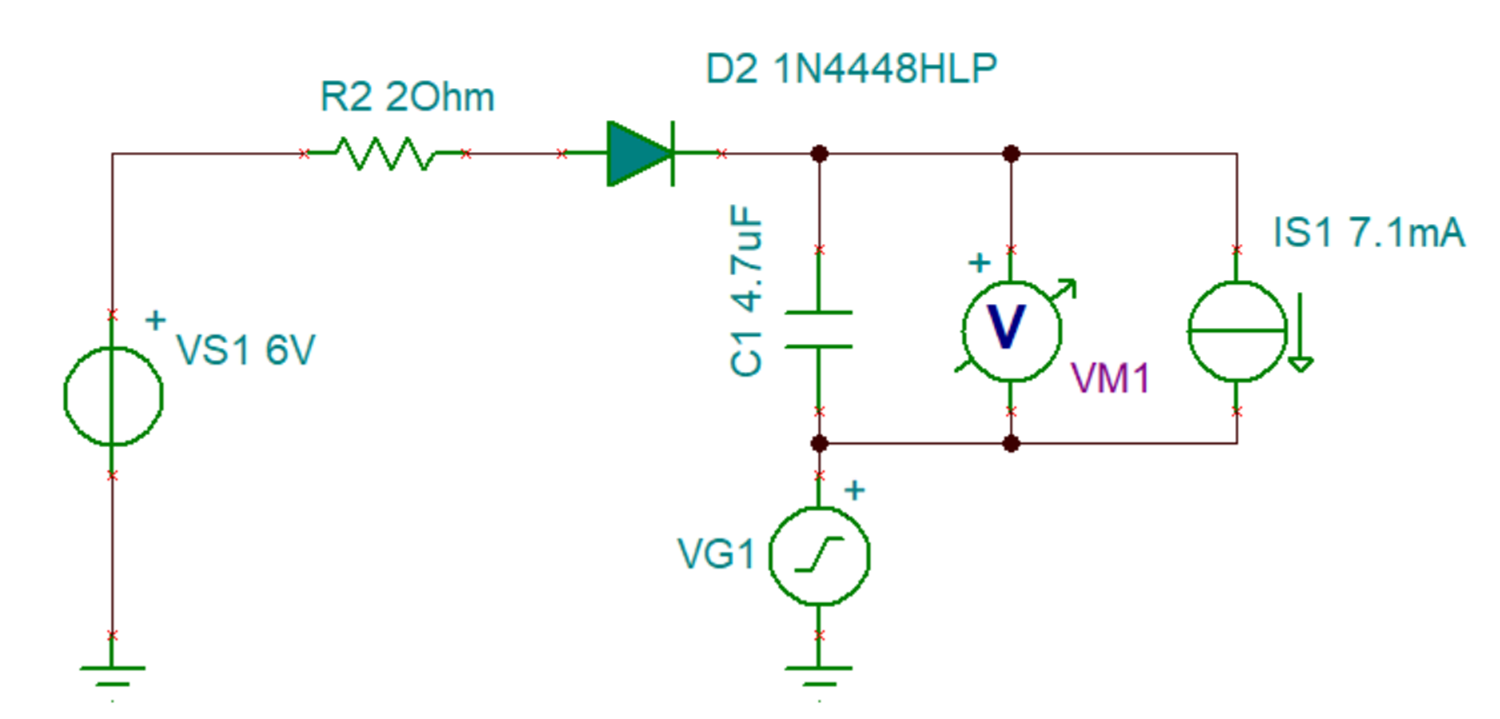
 Figure 2-3 Simulation Model
VS1 is the output from the LDO, VG1 is used to simulate the PWM signal, and IS1 simulates the load draw from the isolated amplifier. Since VS1 is 6 V and the voltage drop across the diode is 300 mV, the maximum output of the bootstrap is 5.4 V. VG1 is sourcing a 20 kHz, 50 Vpp PWM signal with a duty cycle of 50%. C1 is stepped through four different capacitor values.
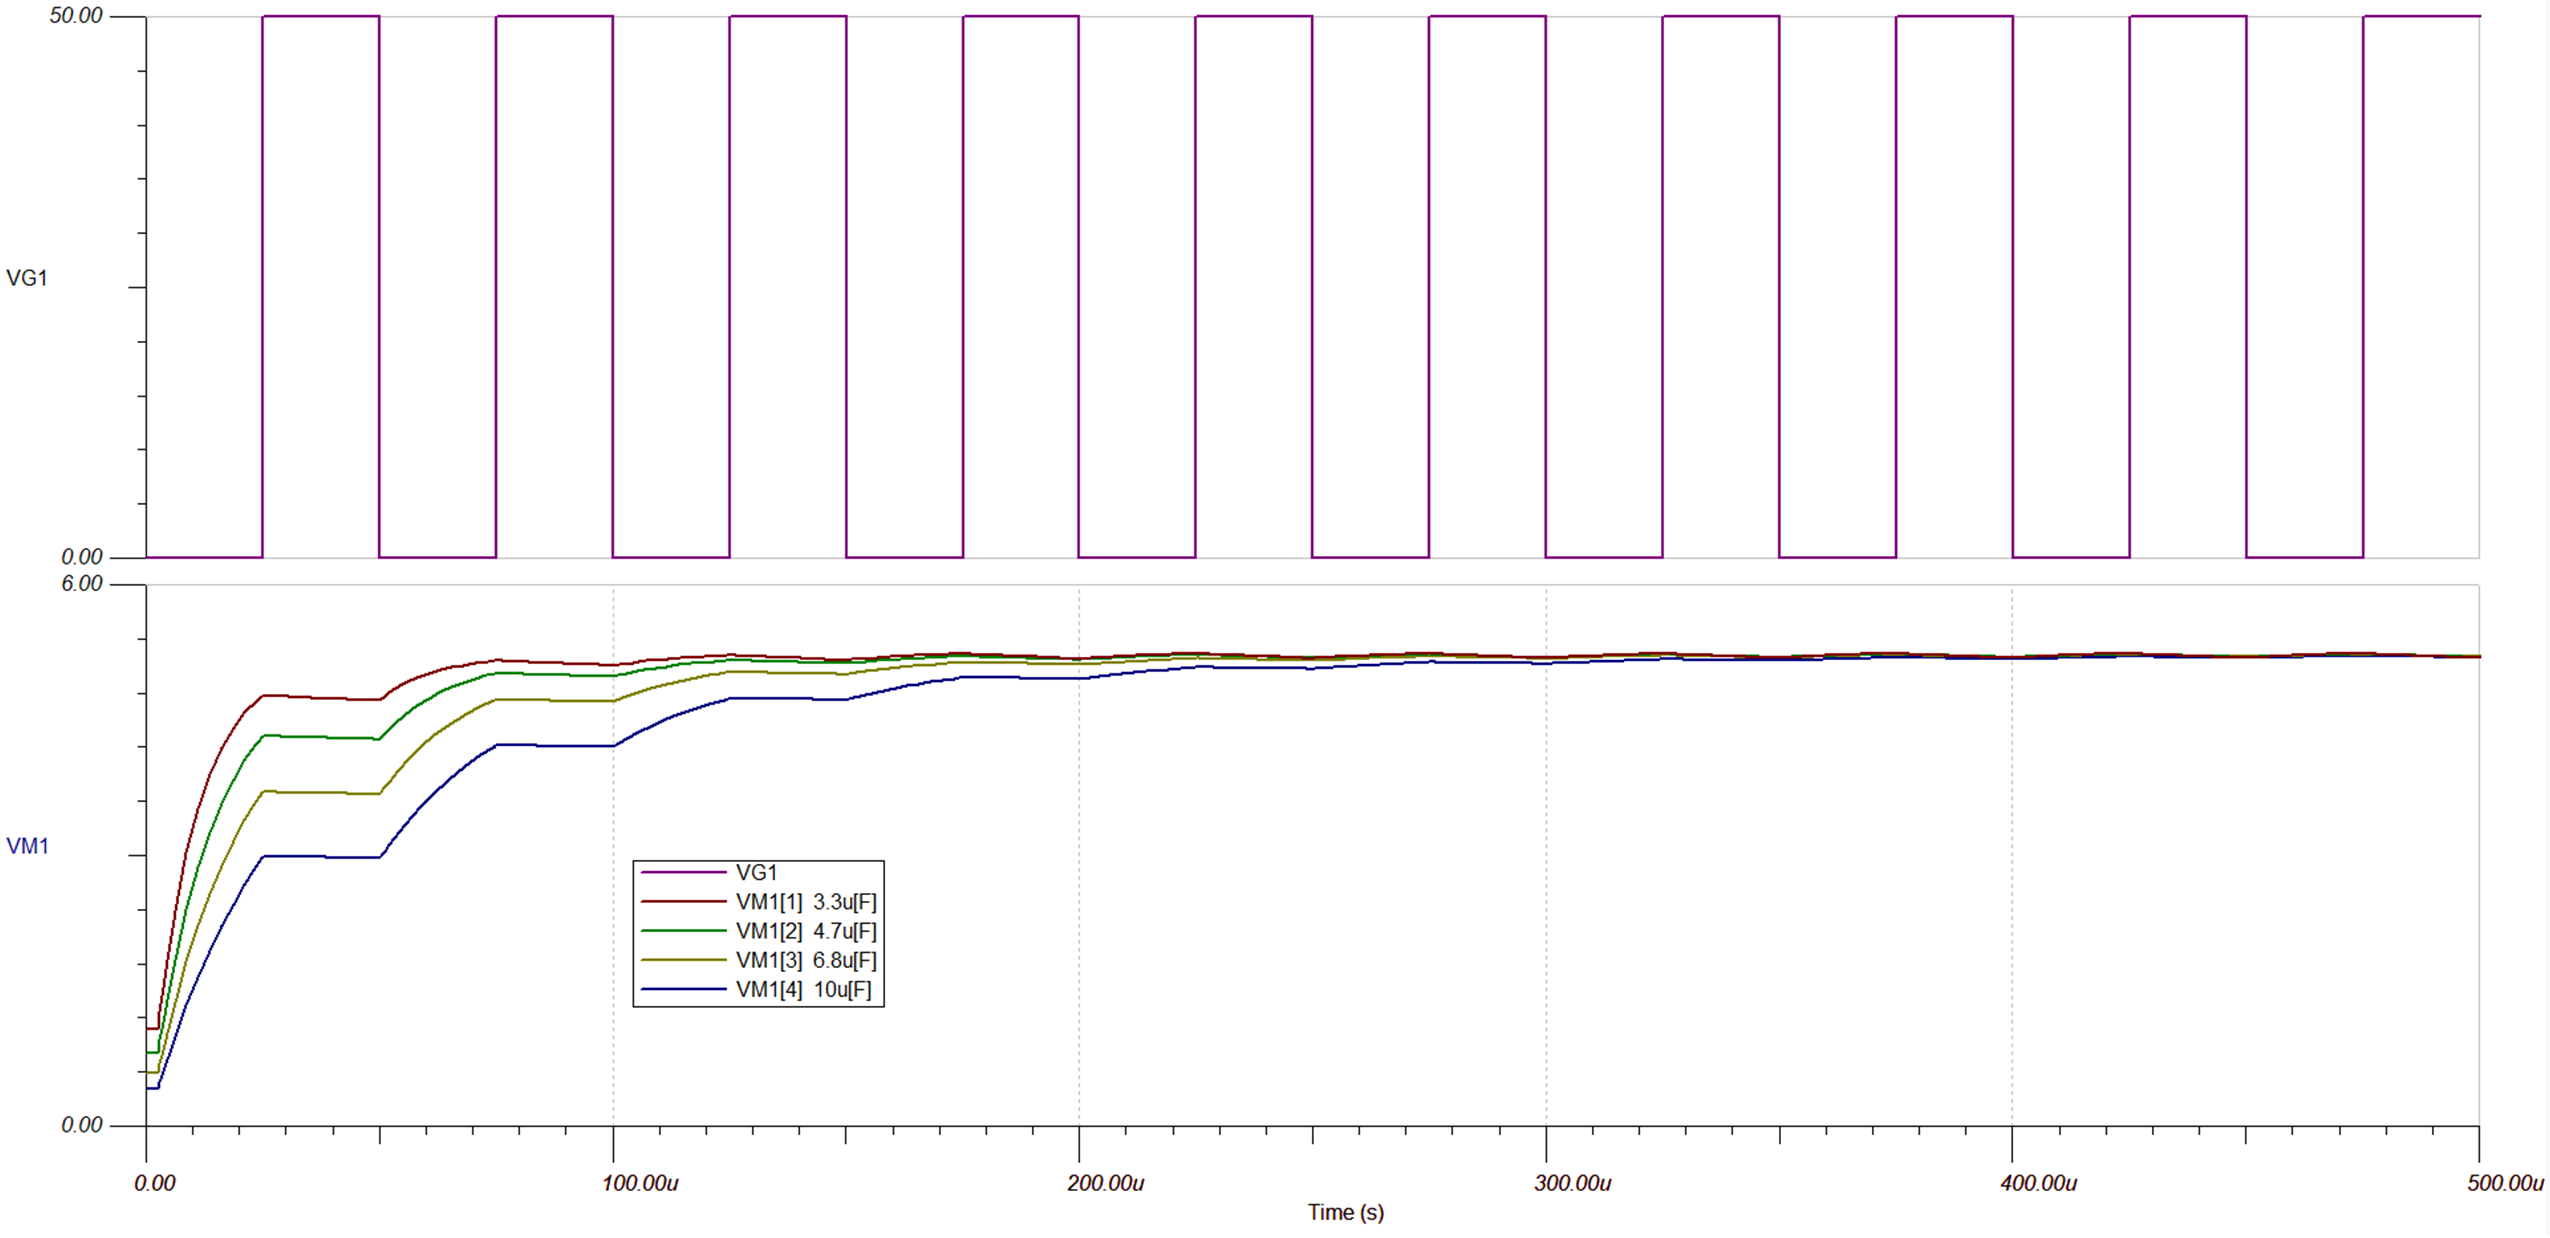
 Figure 2-4 Comparing Capacitor
Values
Figure 2-4 Comparing Capacitor
Values| Capacitor Value (μF) | Steady State Ripple (mV) | Average Steady State Value (V) |
|---|---|---|
| 3.3 | 53.6 | 5.215 |
| 4.7 | 37.7 | 5.200 |
| 6.8 | 25.8 | 5.215 |
| 10 | 17.7 | 5.215 |
Figure 2-4 shows four different capacitor values with the same PWM signal. Table 2-1 shows the steady state output voltage with the different capacitors. Notice that none of the capacitors reach the theoretical maximum steady state value of 5.4 V. However, as the ripple decreases, the start-up time clearly increases. The signal with 4.7 μF has a good balance between start-up time and ripple.
The start-up time and the steady state ripple of the bootstrap circuit also depends on the frequency and duty cycle of the input PWM signal. We can observe this in simulation by setting C1 to a single value and changing the PWM signal generated by VG1.
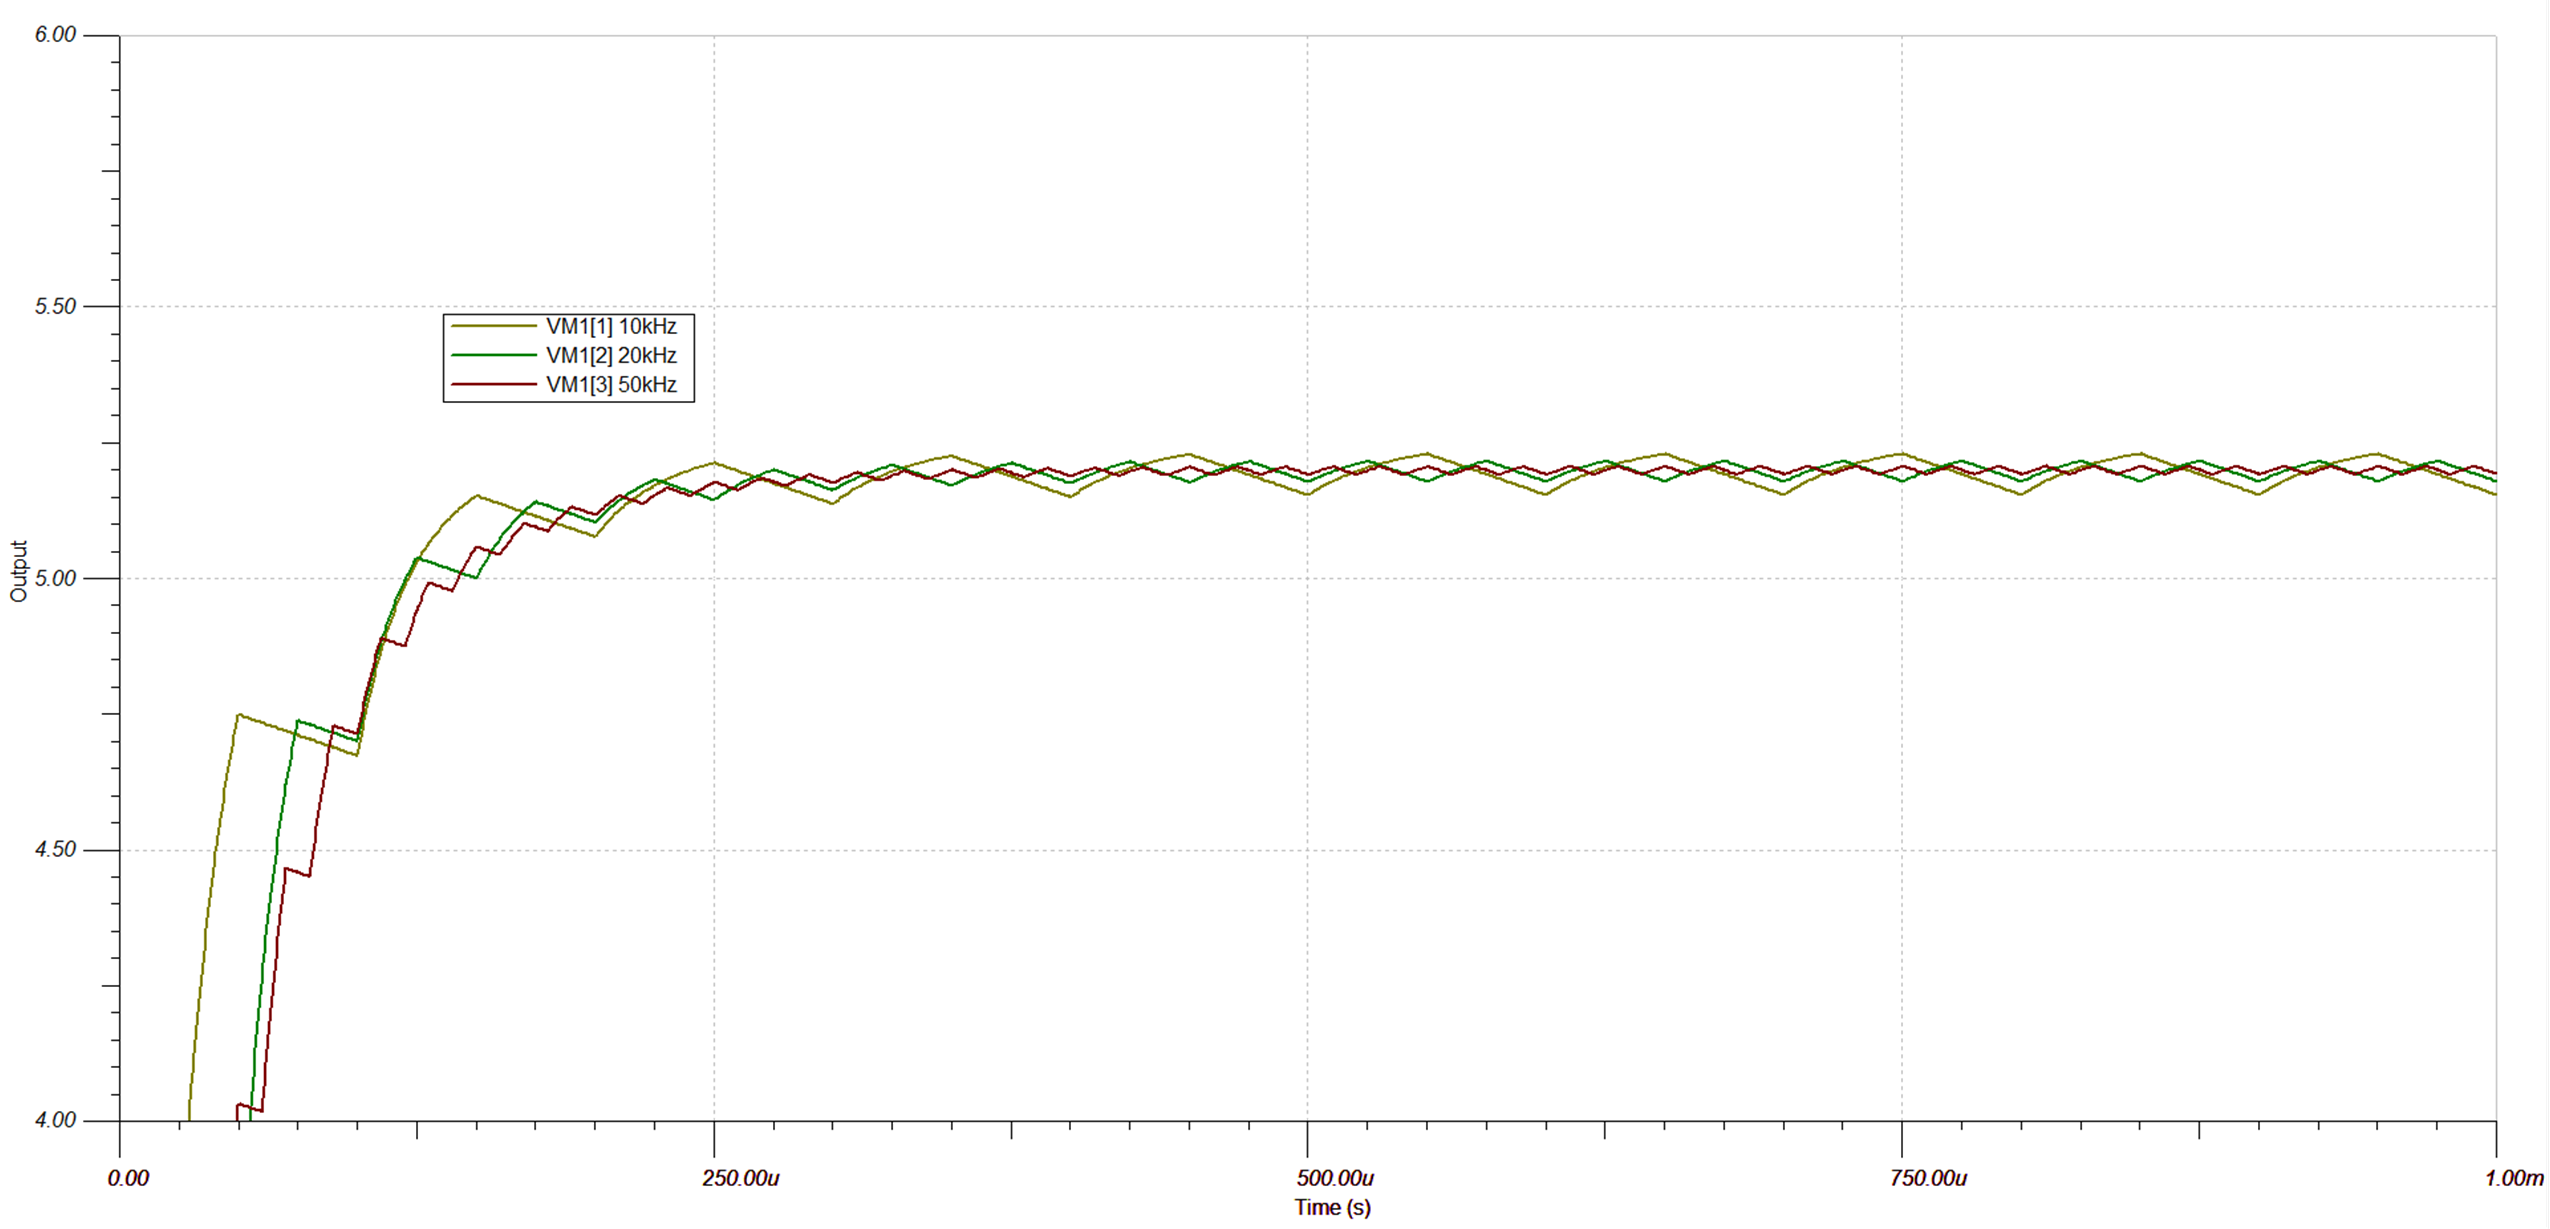
 Figure 2-5 Change PWM Frequency
| PWM Frequency (kHz) | Steady State Ripple (mV) | Average Steady State Value (V) |
|---|---|---|
| 10 | 75.1 | 5.190 |
| 20 | 37.7 | 5.200 |
| 50 | 14.7 | 5.200 |
C1 is 4.7 μF, and the PWM signal has an amplitude of 50 Vpp and a 50% duty cycle. The frequency has a much bigger impact on the output ripple without affecting the start-up time and average steady state too dramatically, as shown in Table 2-2.
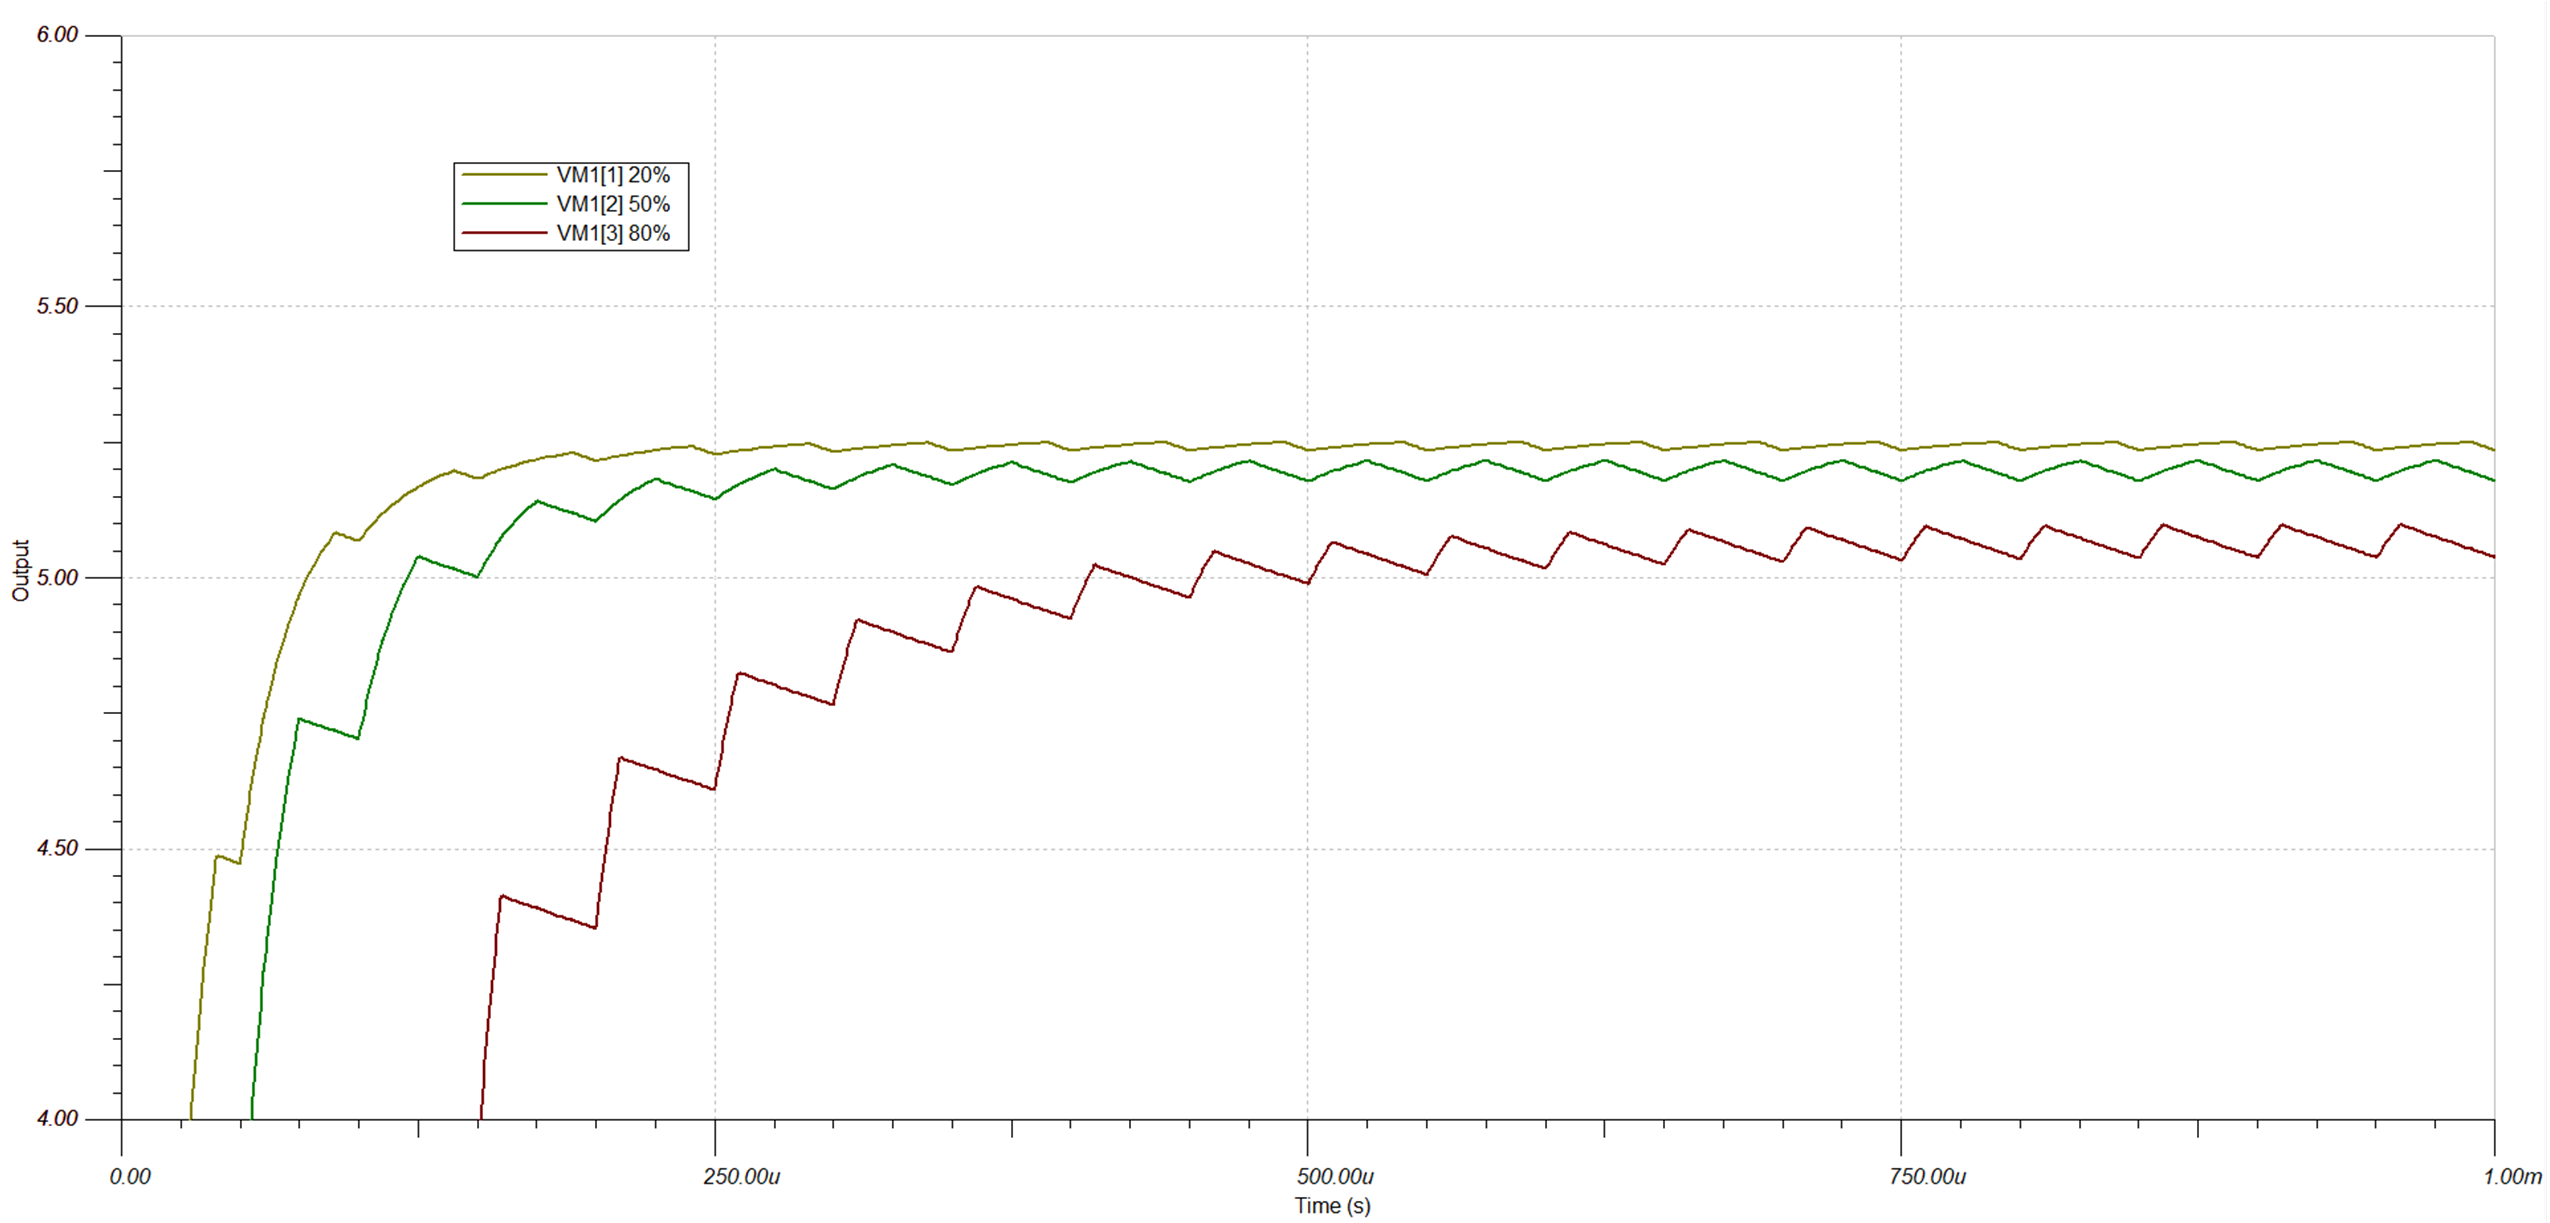
 Figure 2-6 Change PWM Duty Cycle
| PWM Duty Cycle | Steady State Ripple (mV) | Average Steady State Value (V) |
|---|---|---|
| 20% | 14.7 | 5.245 |
| 50% | 37.7 | 5.200 |
| 80% | 59.9 | 5.070 |
C1 is 4.7 μF and the PWM signal has an amplitude of 50 Vpp and a 20 kHz frequency. The start-up time and average output are impacted much more, as shown in Figure 2-6 and Table 2-3.
Too much ripple can impact the performance of the isolated amplifier as the bouncing power supply can cause common-mode errors on the output. However, the isolated amplifier cannot be verified to measure the DUT accurately until the amplifier has reached the minimum recommended value for the amplifier's high-side power supply. Knowing the expected PWM output signal is crucial to designing an effective bootstrap circuit within the system's parameters. However, the 4.7 μF capacitor was selected under the assumption that the PWM signal can have a duty cycle of 50% and have a 20 kHz frequency (see Section 2.1), so the minimum capacitance can be adjusted based on the PWM signal characteristics (see Equation 4).