SLUAA69 July 2020 – MONTH TPS548D22
6.5 Waveforms and Behaviors Analysis of Startup Solution with Lazy Loading
Figure 6-16, Figure 6-17, and Figure 6-18 show the startup waveforms of the lazy loading solution. The inductor current gradually increases in the negative direction and then goes into steady state. The shape of the inductor waveform looks like the normal startup of buck with sourcing current but is horizontally symmetrical. The output voltage before the startup of buck with sourcing current application is 0 V ground. Similarly, for buck with sinking current application, the output needs to be pre-biased to the target level before startup since the output is regarded as the floating ground for the load.
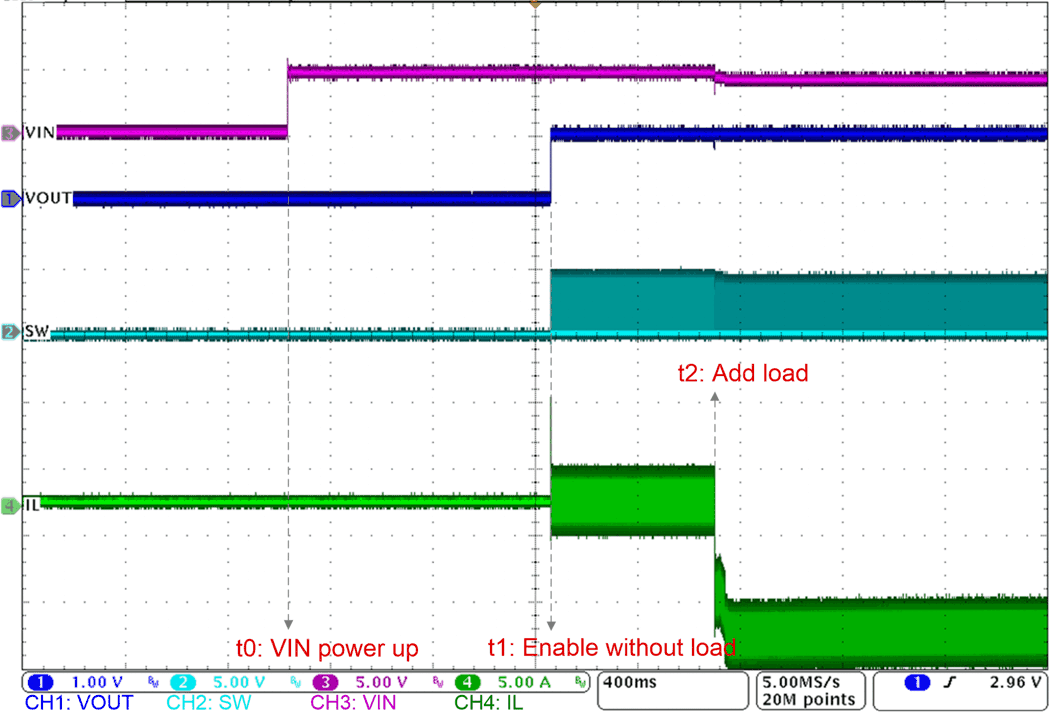 Figure 6-16 Startup Waveforms with Lazy
Loading: 1
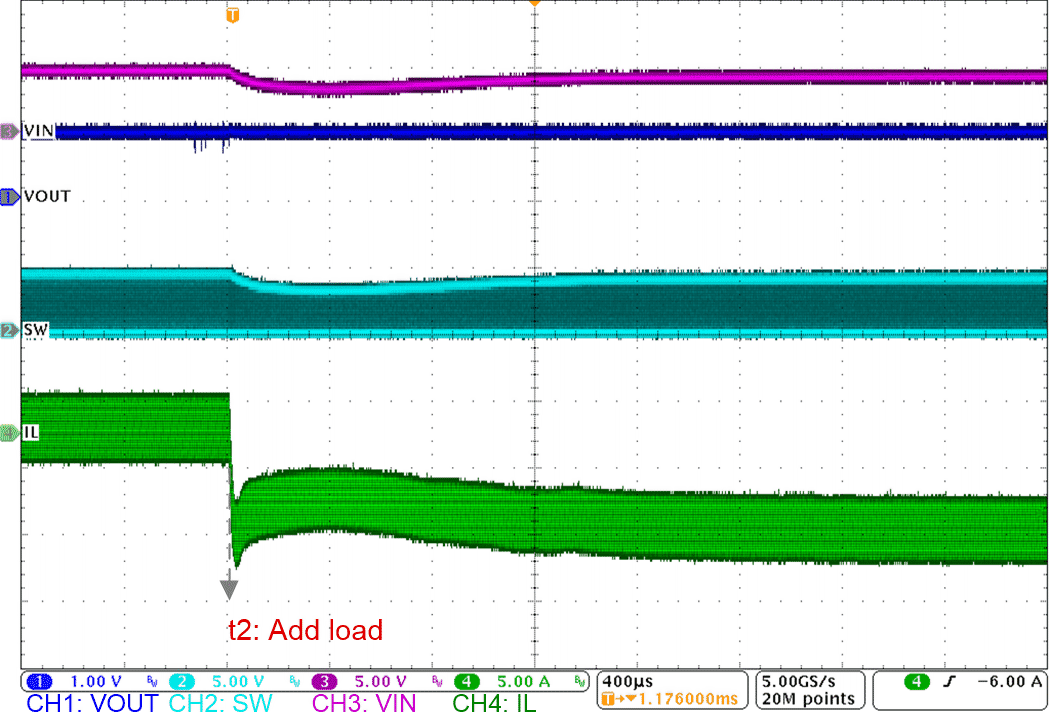 Figure 6-17 Startup Waveforms with Lazy
Loading: 2
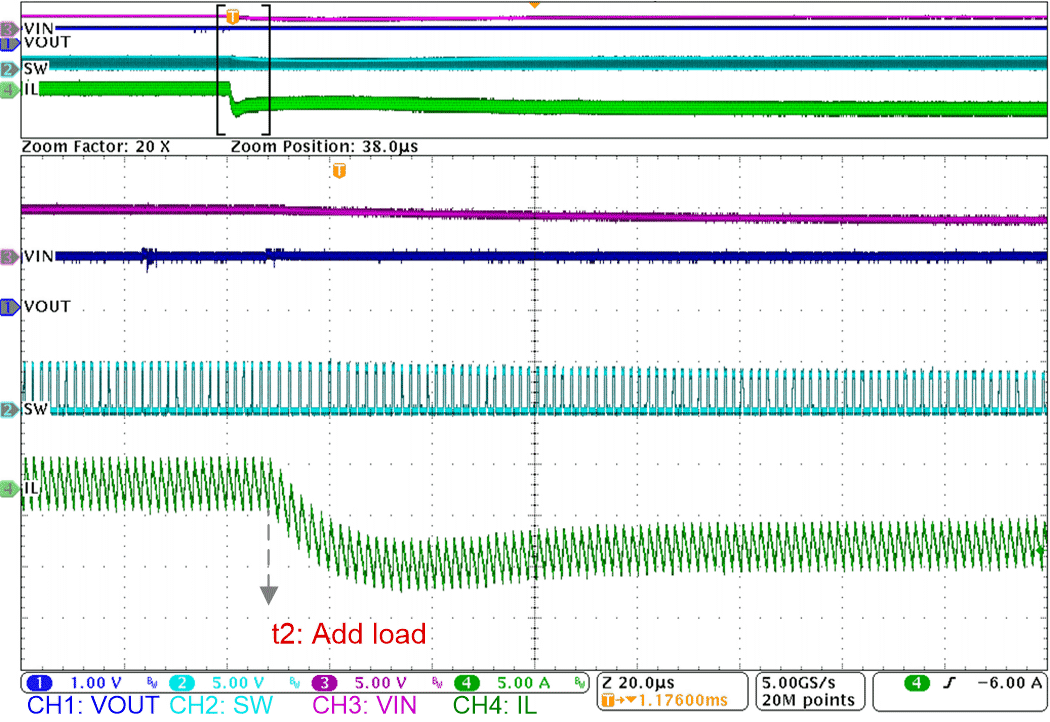 Figure 6-18 Startup Waveforms with Lazy
Loading: 3
Figure 6-18 Startup Waveforms with Lazy
Loading: 3Figure 6-19, Figure 6-20, Figure 6-21, and Figure 6-22 show steady state, output ripple, transient response, and shutdown waveforms.
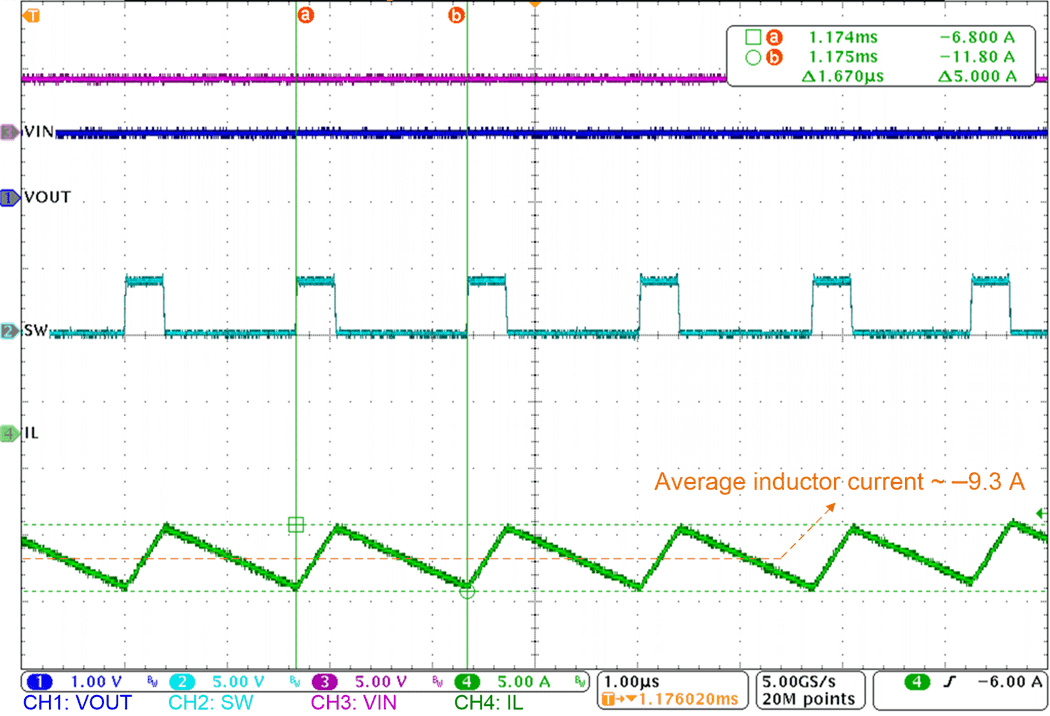 Figure 6-19 Steady State Waveforms of 4.2-V Input, 1-V 9.3-A Output
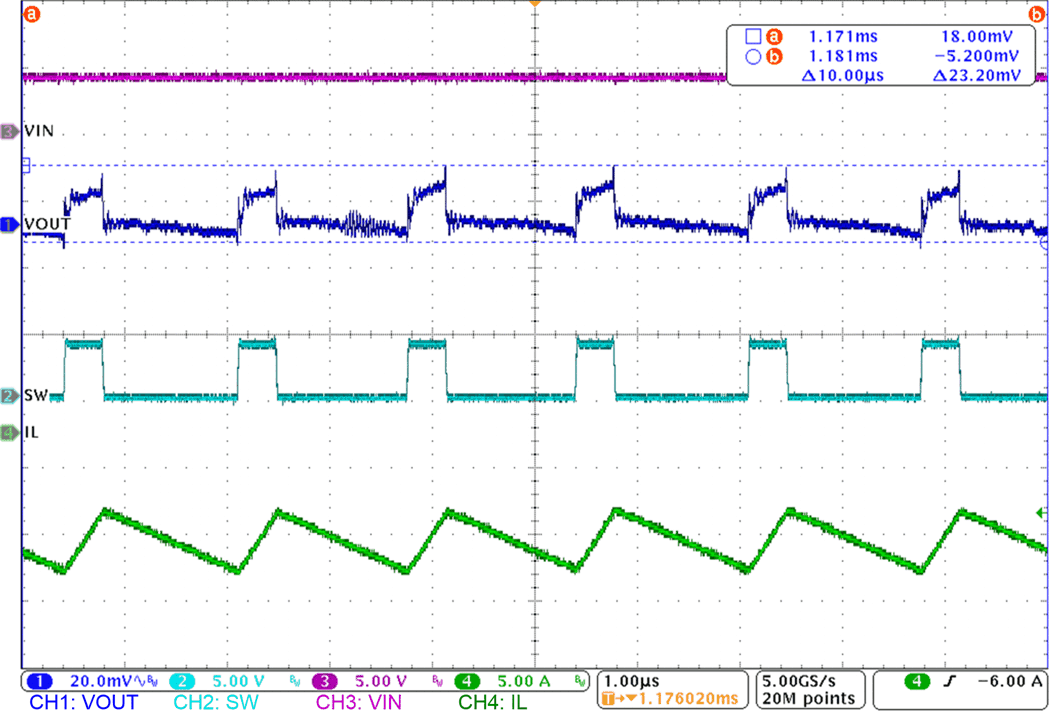 Figure 6-20 Output Ripple Waveforms of 4.2-V Input, 1-V 9.3-A Output
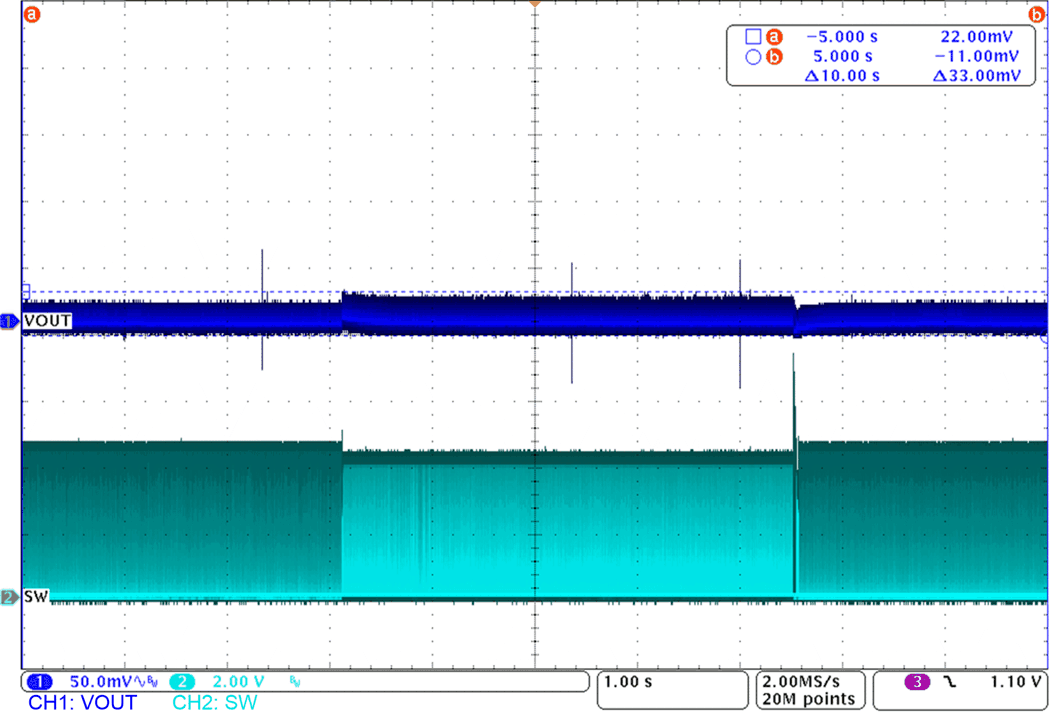 Figure 6-21 Transient Response of 4.2-V Input, 1-V Output, 0 A to 9.3 A, 2.5 A/μs
Transient
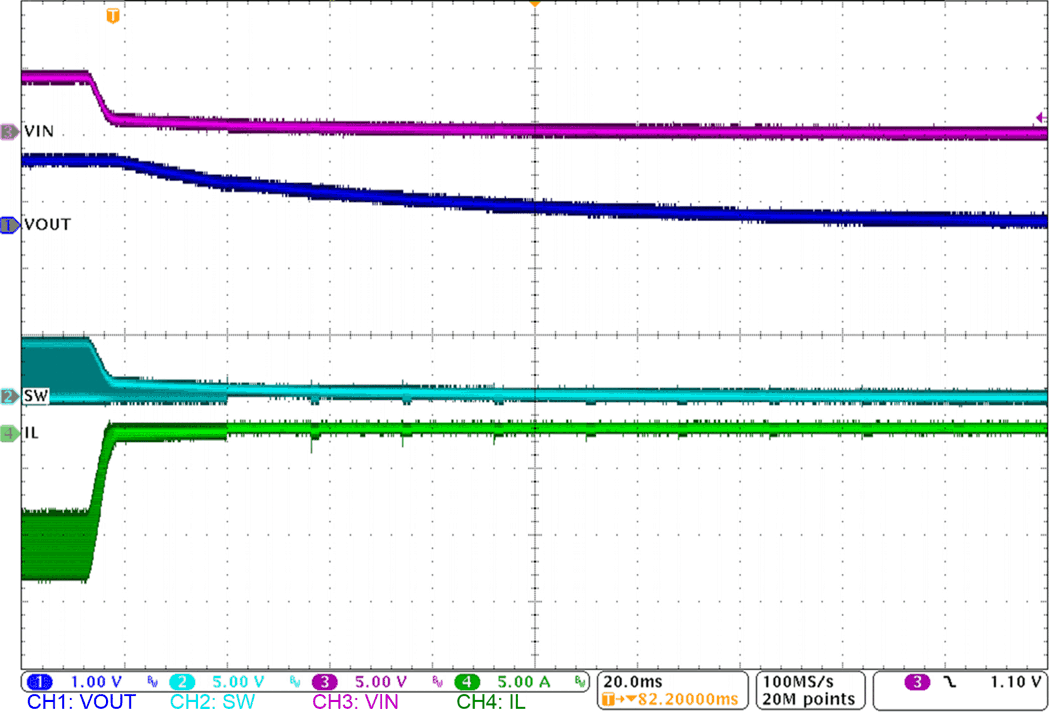 Figure 6-22 Shutdown Waveforms