SLUAAA1 October 2021 BQ21061 , BQ21062 , BQ24179 , BQ25150 , BQ25155 , BQ25157 , BQ25672 , BQ25790 , BQ25792 , BQ25798 , BQ25882 , BQ25883 , BQ25887 , BQ25895 , BQ25896 , BQ25898 , BQ25898D
3 Generating the Lookup Table
A common method of calculating SOC takes the batteries remaining capacity (RemCap) and divides by the batteries maximum capacity, Qmax, where both of these parameters are measured in milliamp-hour (mAh).
First, calculate the total amount of passed charge (battery maximum capacity) over the course of the test.
i[k] is current at reading k, ∆t is the time difference between readings, and m is the total number of readings.
The remaining capacity can be computed at each reading n.
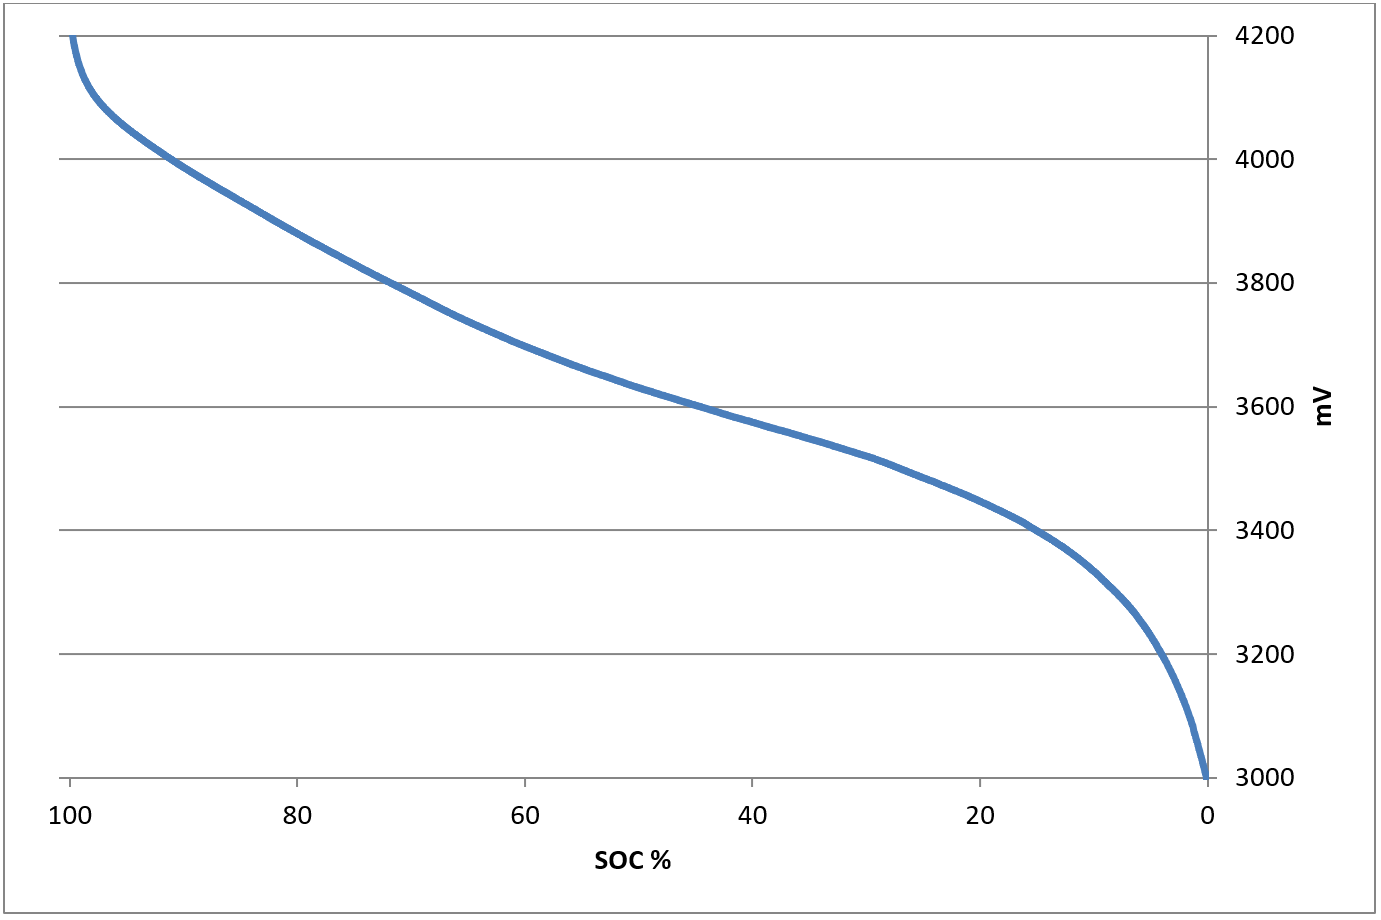
Graphing the battery voltage against SOC generates the typical SOC curve for one li-ion cell.
 Figure 3-1 Vbat vs SOC
This method has been used to determine the accuracy of TI fuel gauges as seen here. The curve above represents the exact SOC for the given discharge.
Example code has been included in the Python Lookup Table Generator section that generates a polynomial regression based on the data generated from the SOC characterization. This data is then mapped to a 101-pt hexadecimal lookup table for easy import into an MCU application. Using 16-bit resolution, this table would only take up 202 bytes of memory.