SLYT821 January 2022 AFE0064 , AFE1256 , AFE2256 , AFE3256 , DDC112 , DDC114 , DDC118 , DDC232 , DDC264 , DDC316
5
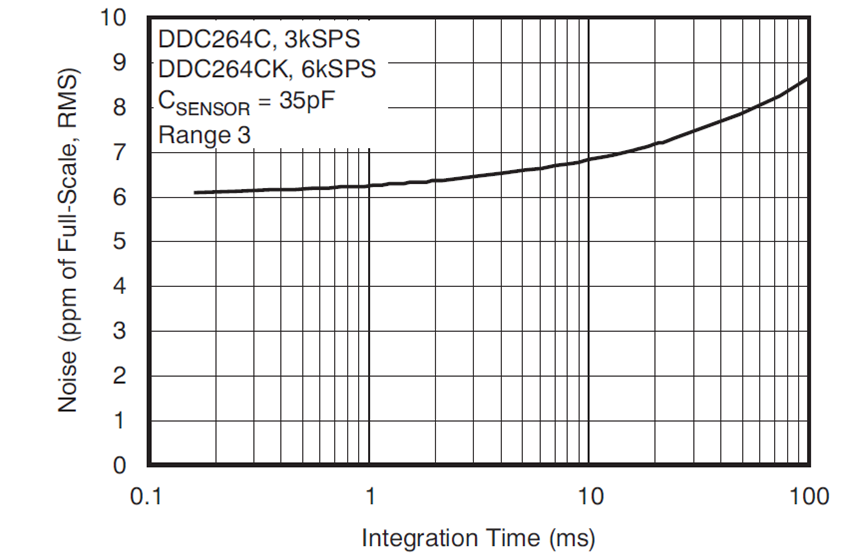
There is an additional noise factor from the low-frequency noise on the device, which is more visible as the integration time increases (see Figure 5-1). Because of this effect, the noise will actually be close to 9 ppm of the full-scale range (150 pC), or 1.35 fCrms.
 Figure 5-1 Noise vs. integration
time
Figure 5-1 Noise vs. integration
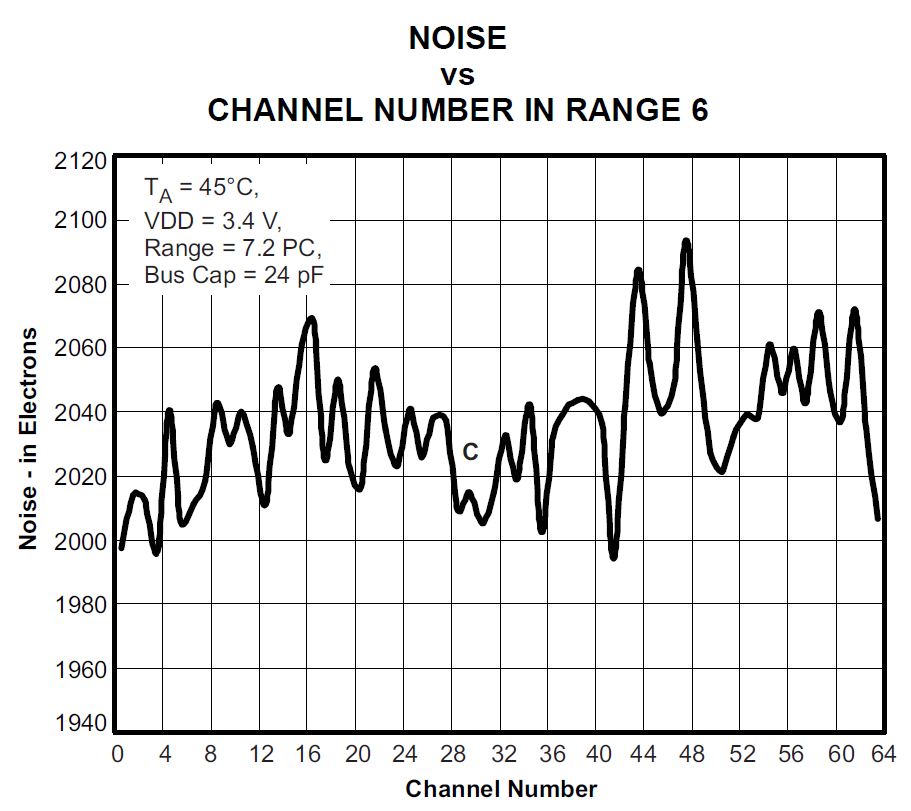
timeIn comparison, the AFE0064 cannot handle the 100-ms interval with a single integration period; it would saturate. The solution is to integrate for shorter periods and add them together. There are many integration periods possible, but in this example we will skip the optimization exercise and choose to integrate for 5 ms, which would result in a maximum charge of 6 pC and hence select range 6 (7.2 pC). The noise for a single sample is then approximately 2,040 electrons (0.3 fCrms); see Figure 5-2. The resulting noise after adding 20 consecutive samples for a 100-ms equivalent will be √20 × 0.3 fCrms = 1.34 fCrms, with a result very similar to the DDC.
 Figure 5-2 Noise vs. channel
number