TIDT234 November 2022
2.3 Thermal Images
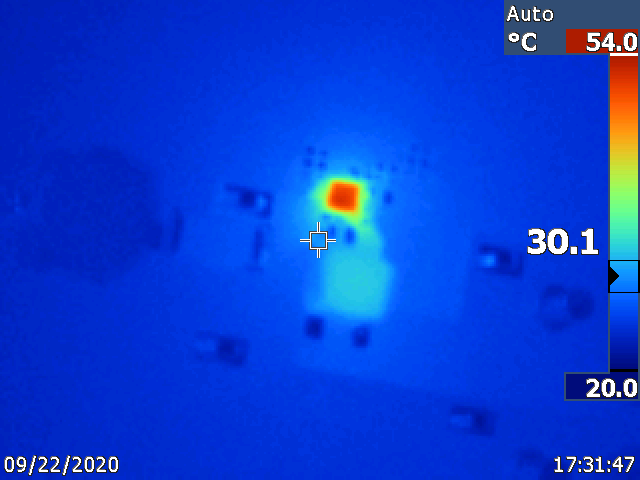
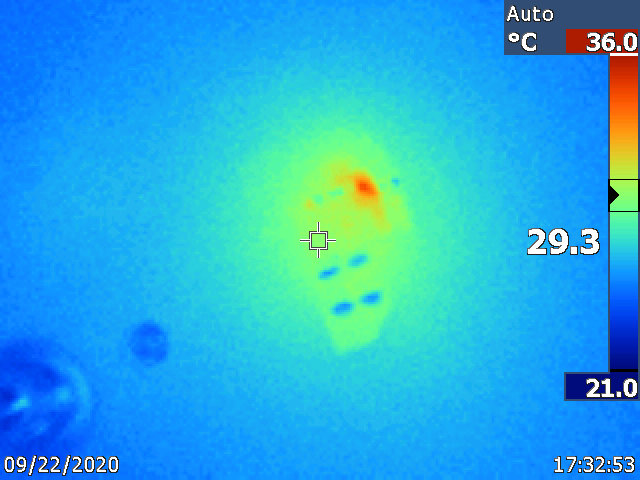
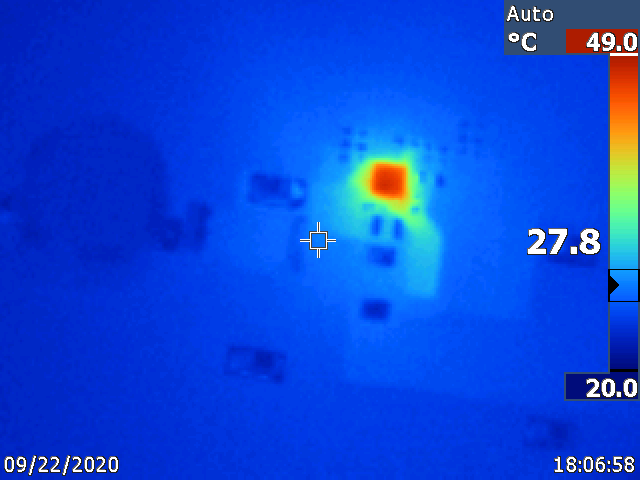
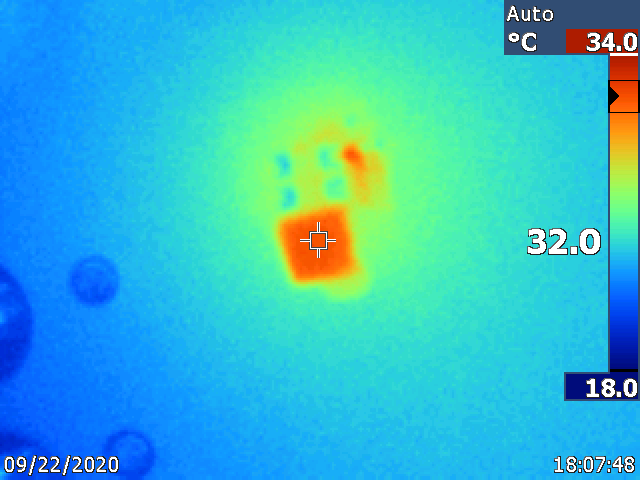
The thermal images in the following figures show operation at 36-V input voltage at 1.2-A load, with no airflow and ambient at room temperature. This is considered the worst-case operating condition, with the highest power loss. Thermals images were taken of both top and bottom side of the boards and were captured after the board had reached thermal equilibrium.
 Figure 2-9 Thermal Image, RevA Board,
36-V Input, 1.2-A Load, Top-Side
 Figure 2-10 Thermal Image, RevA Board,
36-V Input, 1.2-A Load, Bottom-Side
 Figure 2-11 Thermal Image, RevB Board,
36-V Input, 1.2-A Load, Top-Side
 Figure 2-12 Thermal Image, RevB Board,
36-V Input, 1.2-A Load, Bottom-Side