SBOA537 March 2022 TMP61 , TMP61-Q1 , TMP63 , TMP63-Q1 , TMP64 , TMP64-Q1
3 Creating the Scatter Plot
This section shows how to create the scatter plot using Microsoft Excel.
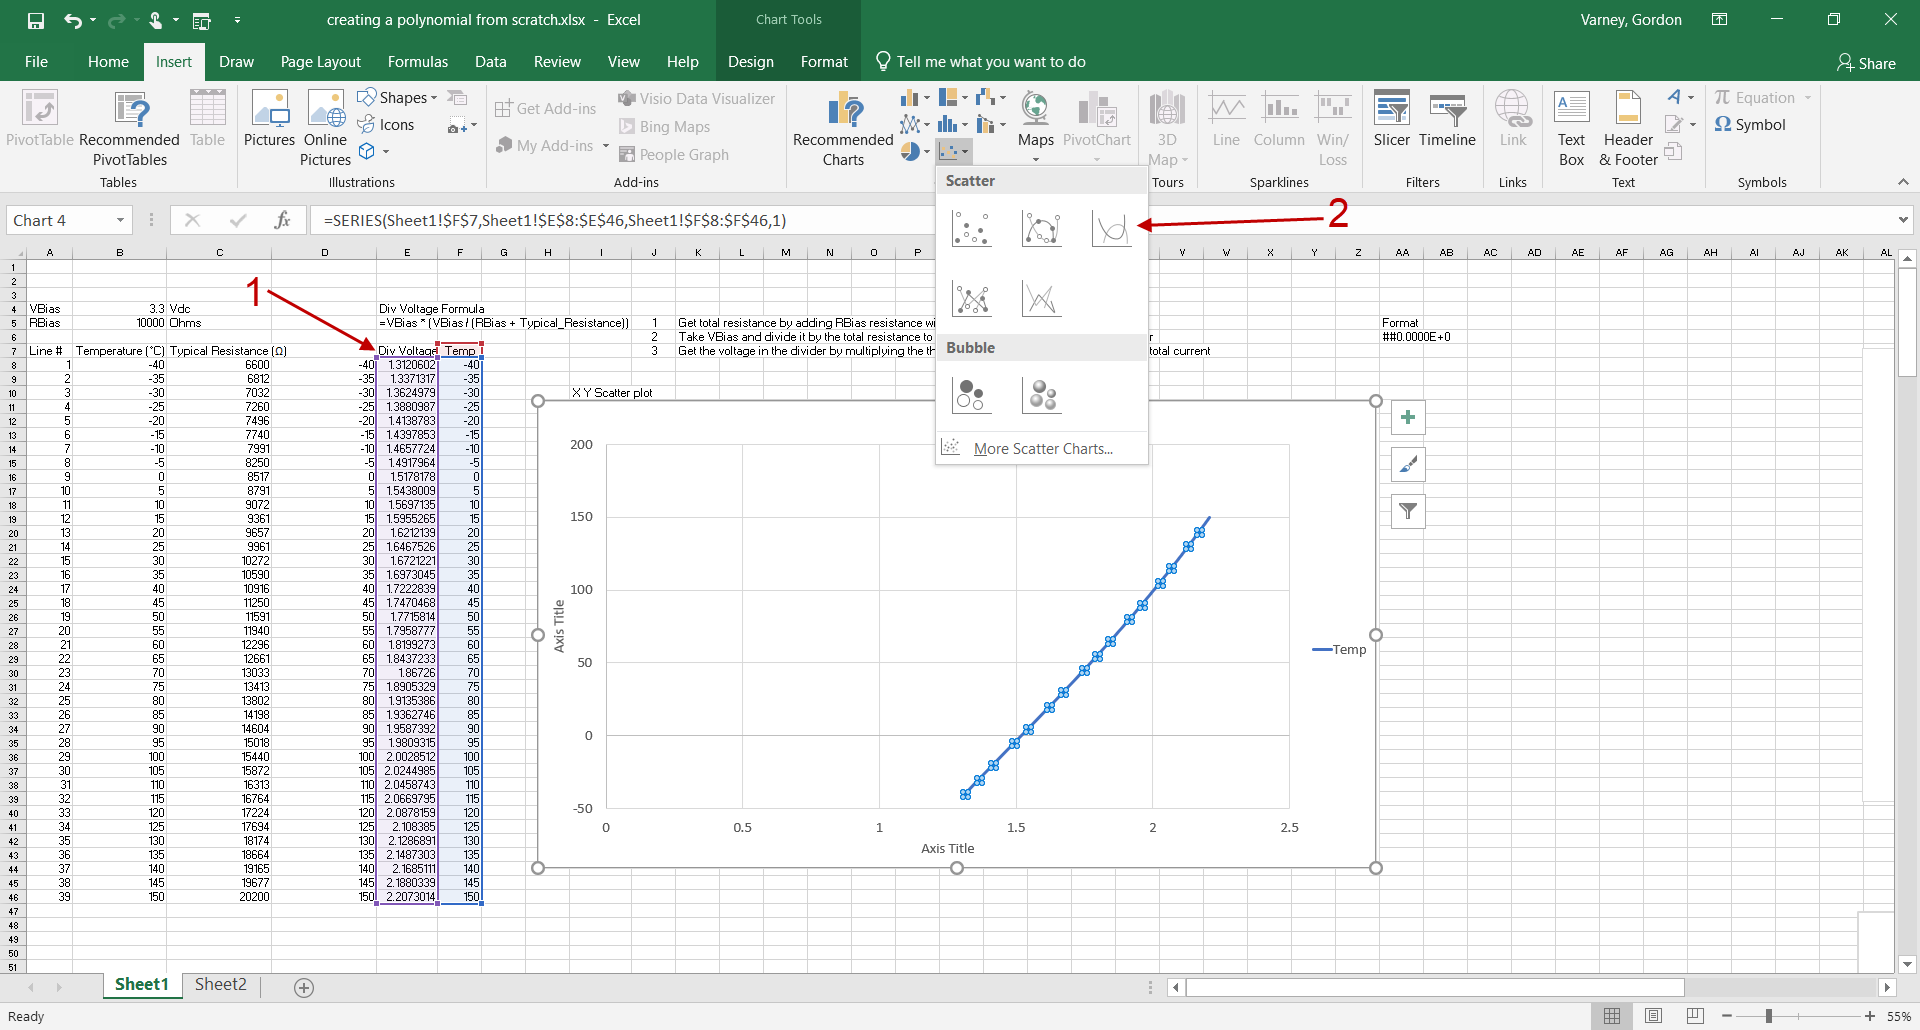
- Highlight the created data. Make sure the voltage (x axis) is on the left column and the temperature (y axis) is in the right column.
- Select Insert in the top menu bar. Find Scatter plots in the Charts section. Select scatter plot with smooth lines as the desired plot type.
These steps yield a plot similar to Figure 3-1 with the temperature data on the left in the y axis and the voltage data on the bottom in the x axis.
 Figure 3-1 Creating a Scatter
Plot