SBOA537 March 2022 TMP61 , TMP61-Q1 , TMP63 , TMP63-Q1 , TMP64 , TMP64-Q1
2 Creating the Plot for the Fourth-Order Polynomial
The plot starts with choosing the correct chart type for the data. Selecting the wrong plot type can easily happen when it comes to line charts and scatter plots. They look very similar, especially when a scatter plot is displayed with connecting lines. There is a big difference in the way each of these chart types present data along the horizontal and vertical axes.
In a line chart, the values are displayed as two separate data points that are evenly distributed along the horizontal axis. This is because in a line chart, the vertical axis is a value axis and the horizontal axis is a category axis. Instead of displaying values, a category axis shows evenly spaced groupings (categories) of data. Because the data has only values and no categories, Microsoft Excel automatically generates numbered categories along the category axis, using numbers 1 through 9 on the x axis. The category axis can be changed and a different number set can be used on the x axis, but it is still a category grouping.
Conversely, a scatter chart has two value axes – it displays values rather than categories on the horizontal axis. Therefore, a scatter plot displays the data values as x values on the horizontal axis, and the chosen reference values as y values on the vertical axis. Because this chart type has two value axes, it can display a single data point at the intersection of each x and y value.
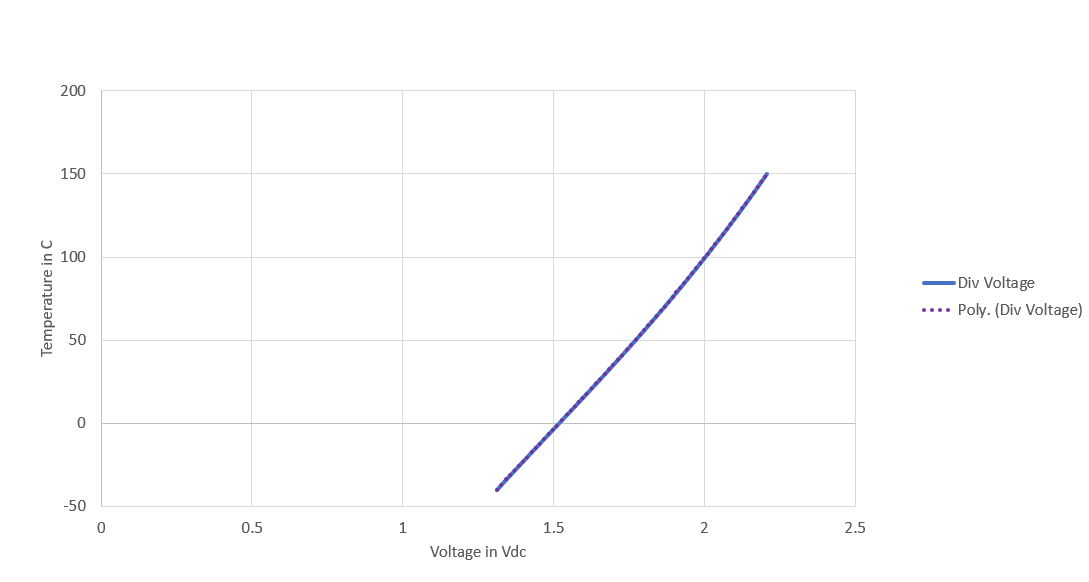
The first column selected is the x axis, while the second data column is the y axis. The goal here is to know what ADC voltage value is needed for each temperature value. Displaying the temperature (y axis) and intersecting the voltage (x axis) in Figure 2-1 allows calculation of the temperature from the known voltage using a polynomial equation based on the curve of the plot.
 Figure 2-1 Plot Relationship for the
Polynomial