SLUAAI0 January 2022 TPS62810-Q1 , TPS62811-Q1 , TPS62812-Q1 , TPS62813-Q1 , TPS62816-Q1 , TPS628501 , TPS628501-Q1 , TPS628502 , TPS628502-Q1 , TPS628503 , TPS628503-Q1 , TPS628510 , TPS628511 , TPS628512 , TPS62870 , TPS62870-Q1 , TPS62871 , TPS62871-Q1 , TPS62872 , TPS62872-Q1 , TPS62873 , TPS62873-Q1 , TPS62874-Q1 , TPS62875-Q1 , TPS62876-Q1 , TPS62877-Q1 , TPS62A01 , TPS62A01A , TPS62A02 , TPS62A02A , TPS62A06 , TPS62A06A , TPSM82810 , TPSM82813 , TPSM8287A06 , TPSM8287A10 , TPSM8287A12 , TPSM8287A15 , TPSM8287B30
4 Bode Plot Reconstruction and Comparisons with Voltage Injection Method
The loop gain is a complex number with a real and an imaginary part due to the complex impedance. The information needed to calculate the loop gain are the magnitude Mag[T(s)] and the phase Phase[T(s)] respectively shown in Equation 4 and Equation 5.
To visualize data and apply formula to taken values, the use of an analytics solution may be required. All Network Analyzer do not provide flexible interface to analyze data.
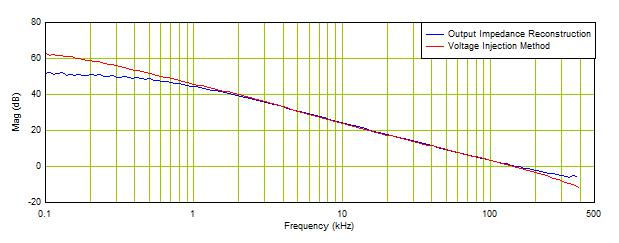
Figure 4-1 shows a comparison of the reconstructed gain to measured voltage injection method.
The reconstructed gain using the Equation 4 from the impedance measurements shows a very good matching result until the lowest frequency. The red curve shows the real loop gain and the blue curve the calculated loop gain.
 Figure 4-1 Loop Gain Magnitude with Output Impedance Reconstruction (blue) and with Voltage Injection Method (red)
Operating Conditions: =3.3 V, =1.0V, =2 A
Crossover Frequency: 141.25 kHz (Red curve), 146.27 kHz (Blue curve)
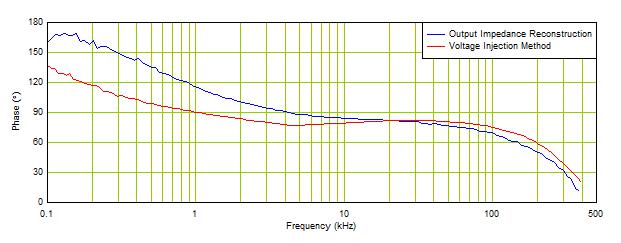
Figure 4-2 shows a comparison of the reconstructed phase to measured voltage injection method.
The red curve of Figure 4-2 shows the measured voltage injection method phase and the blue curve shows the calculated phase, reconstructed using the Equation 5 from the impedance measurements.
 Figure 4-2 Loop Gain Phase with Output Impedance Reconstruction (blue) and with Voltage Injection Method (red)
Operating Conditions: =3.3 V, =1.0V, =2 A
Phase Margin: 69.28° C (Red curve), 61.17° C (Blue curve)