SLUAAR3 December 2023 BQ27426 , BQ27427 , BQ27Z561 , BQ27Z746 , BQ28Z610 , BQ34Z100 , BQ40Z50 , BQ40Z80
7.2 Comparing SOC Error
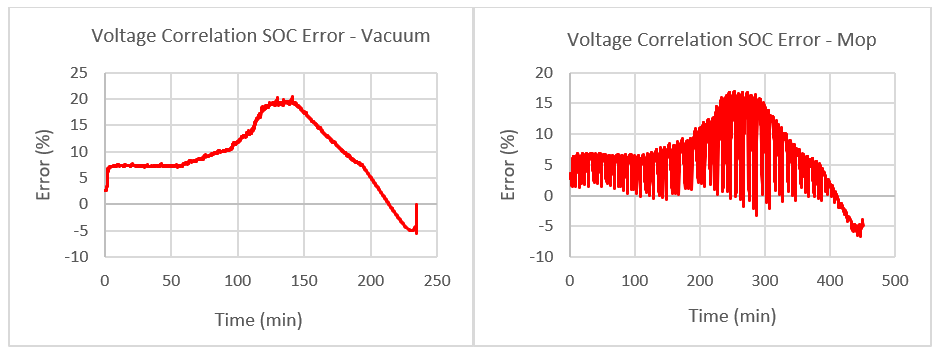
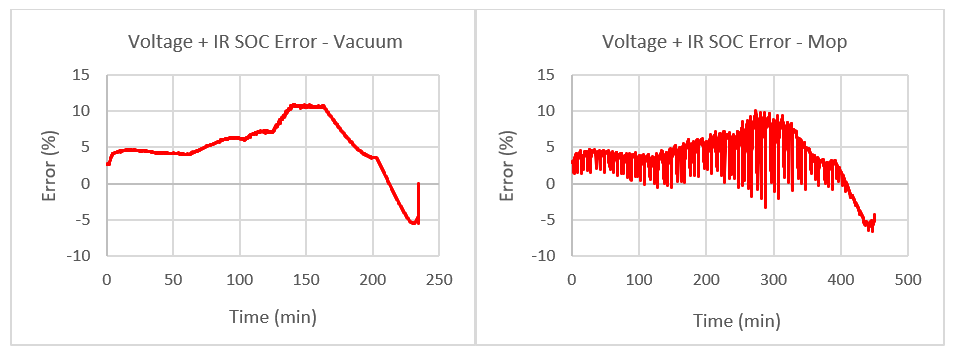
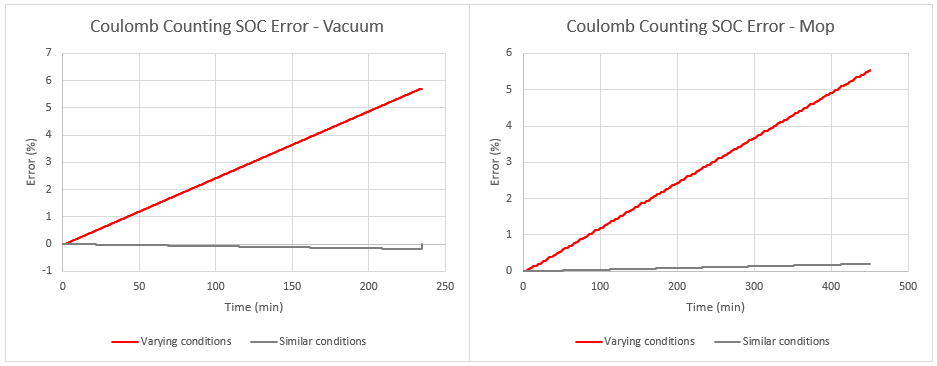
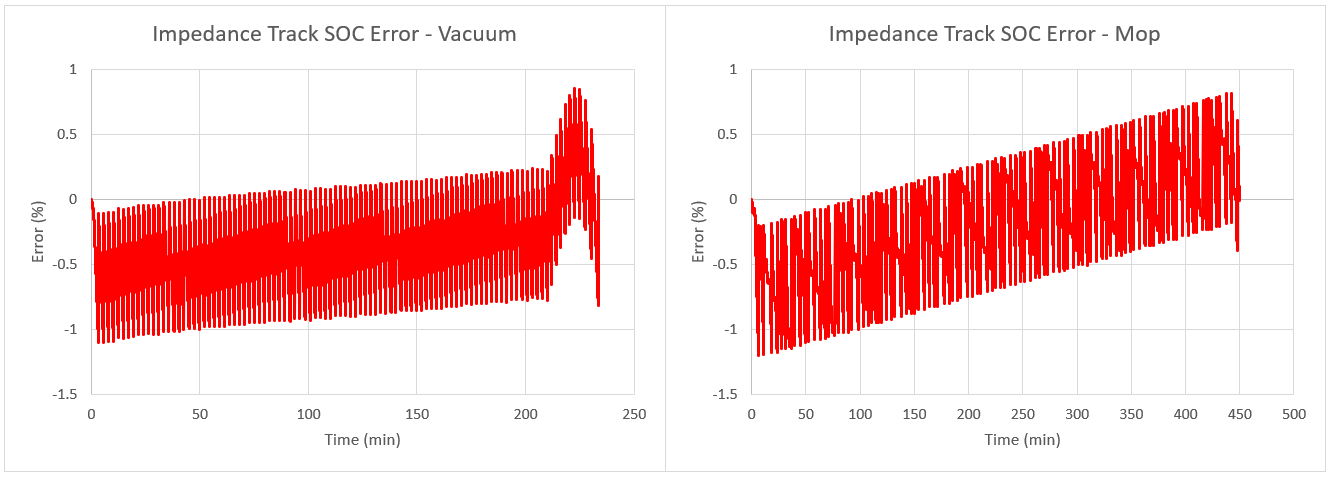
The peak error for voltage correlation is around 20% for test 1 and 17% for test 2. The peak error for voltage + IR correction isaround 11% for test 1 and 10% for test 2. The peak error for coulomb counting is about 6% for both test 1 and 2, assuming the FCC was not learned. On subsequent cycles, assuming temperature and load is similar, coulomb counting can have low error. The peak error for Impedance Track is about 1% for both test 1 and 2.
CEDV accuracy is very similar to the coulomb counter error, so the CEDV is not shown in the graphical comparison for these load profile examples.
 Figure 7-3 Voltage Correlation SOC Error
for Test 1 and 2
 Figure 7-4 Voltage + IR Correction SOC
Error for Test 1 and 2
 Figure 7-5 Coulomb Counting SOC Error for
Test 1 and 2
 Figure 7-6 Impedance Track SOC Error for
Test 1 and 2