SLVAEG1A August 2019 – May 2021 TLV62568 , TLV62568A , TPS62840
4 Testing Setup
In order to compare the three architectures, the tests conducted on each are as follows:
- System efficiency at both light load (10 µA) and full load (200 mA).
- System input current at light load (10 µA) and full load (200 mA), and no load (IC enabled)
- Ripple voltage and ripple frequency at both light load (10 µA) and full load (200 mA)
- Ripple voltage transient response with dynamically switching load between 50 µA and 200 mA at 1 kHz
- Thermal imaging test
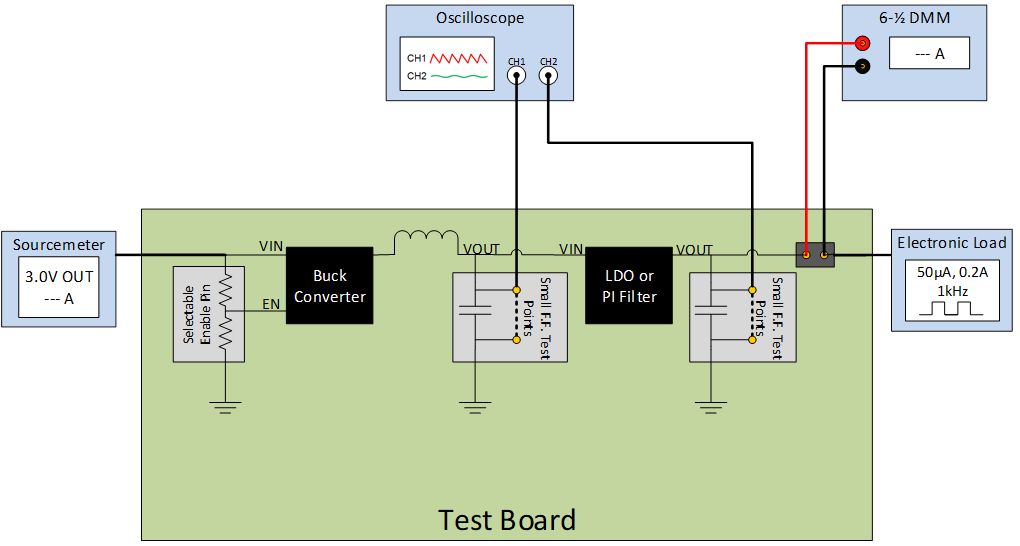
The setup for testing, shown in Figure 4-1, consists of:
- The test board
- Agilent DC Supply E3633A
- Keithley Sourcemeter 2450
- Tektronix Mixed Domain Oscilloscope MDO3024, with a bandwidth of 200 MHz and sampling rate of 2 GSa/s
- Keysight 6-1/2 DMM 34461A
- Kikusui Electronic Load PLZ164WA
 Figure 4-1 Test Setup Diagram
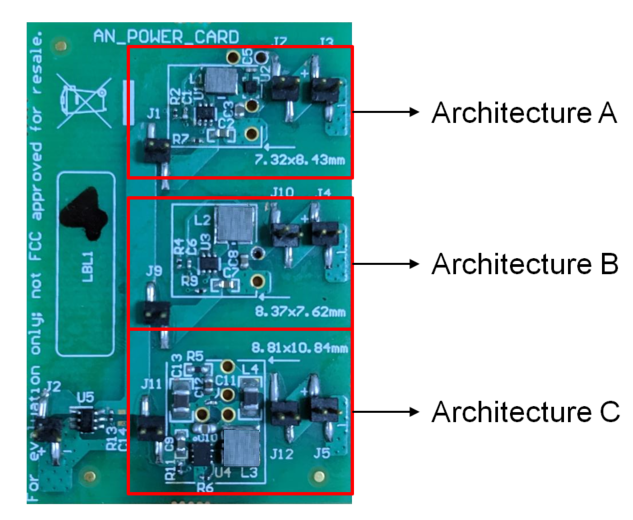
In order to test and demonstrate these architectures, a test board with all three architectures was designed and fabricated. The board is shown in Figure 4-2, including the dimensions of each architecture on the board for form factor comparison. Note that all components on the board shown are on the top side of the board for direct comparison – the board area can be reduced by placement of components on both sides of the board.
Some ripple measurements taken were at or beneath the noise floor of the oscilloscope used, which was observed to be -86 dB (or 142 µVpp). These results are denoted as "Noise Floor" in the results table.
 Figure 4-2 Test Board Image