SLVAEG1A August 2019 – May 2021 TLV62568 , TLV62568A , TPS62840
5 Testing Results
| PARAMETER | ARCHITECTURE A | ARCHITECTURE B | ARCHITECTURE C |
|---|---|---|---|
| IQ (Load = 0 A, Device Enabled) | 34 µA | 2.7 mA | 75 nA |
| Light Load (ILOAD = 10 µA) | |||
| System Efficiency | 10% | 0.1% | 93% |
| Stage 1 Ripple | 22.4 mV | 6.0 mV | 5.20 mV |
| 1.87% Accuracy | 0.50% Accuracy | 0.43% Accuracy | |
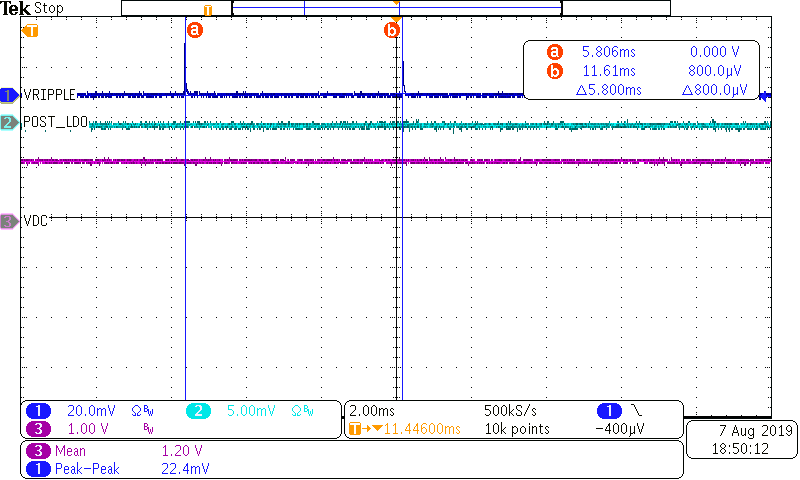 Architecture A at 10 µA load. Both pre- and post-LDO
ripples shown in dark blue and light blue, respectively. LDO rejects
> 50 dB at 20 Hz PFM frequency Architecture A at 10 µA load. Both pre- and post-LDO
ripples shown in dark blue and light blue, respectively. LDO rejects
> 50 dB at 20 Hz PFM frequency |
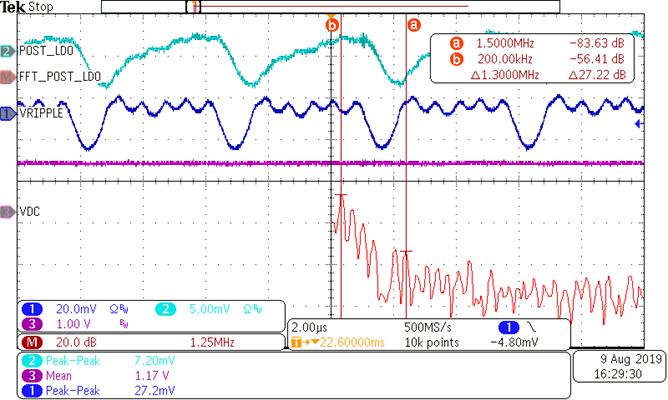
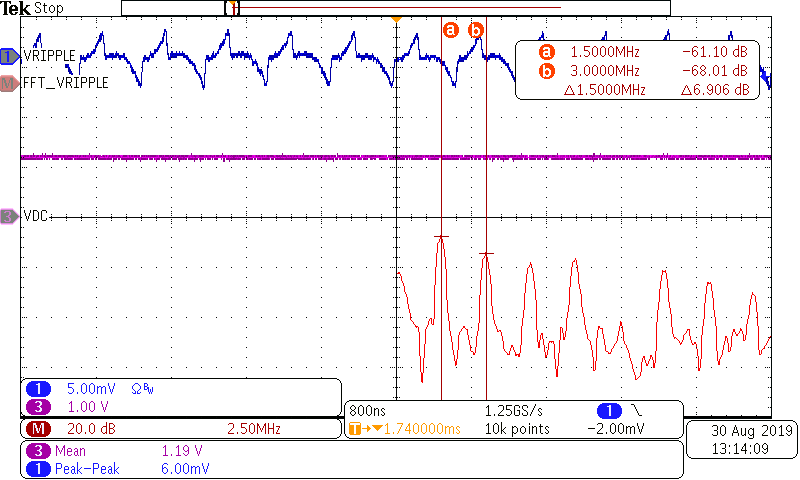 Architecture B at 10 µA load. Ripple (dark blue) and
FFT plot of ripple (red) showing expected PWM ripple at 1.5
MHz Architecture B at 10 µA load. Ripple (dark blue) and
FFT plot of ripple (red) showing expected PWM ripple at 1.5
MHz |
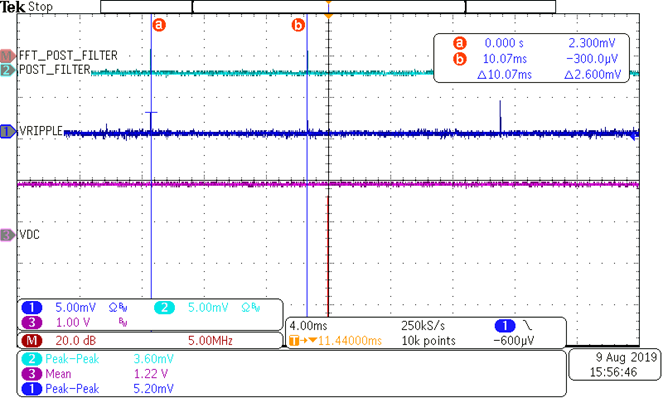 Architecture C at 10 µA load. Both pre-and post-PI
filter ripples shown in dark blue and light blue, respectively. PI
filter rejects only 3 dB at 100 Hz PFM frequency Architecture C at 10 µA load. Both pre-and post-PI
filter ripples shown in dark blue and light blue, respectively. PI
filter rejects only 3 dB at 100 Hz PFM frequency |
|
| Stage 2 Ripple | Noise Floor | N/A | 3.60mV |
| <0.01% Accuracy | 0.30% Accuracy | ||
| Full Load (ILOAD = 200 mA) | |||
| System Efficiency | 61% | 91% | 88% |
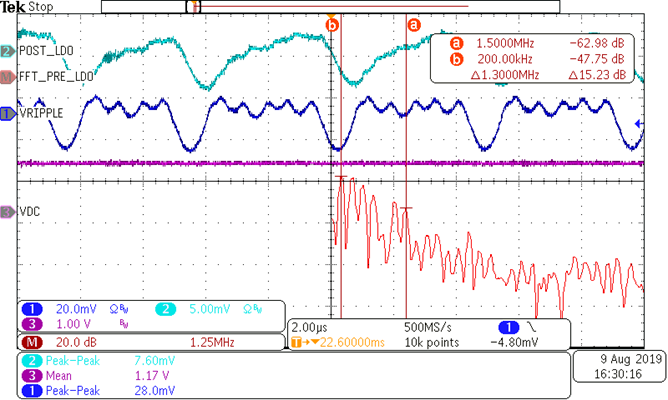
| Stage 1 Ripple | 28.0 mV | 6.0 mV | 3.68 mV |
| 2.33% Accuracy | 0.50% Accuracy | 0.31% Accuracy | |
 FFT plot for ripple before LDO with 6.5 MHz
bandwidth; cursors at low frequency 200 kHz peak and nominal
switching frequency 1.5 MHz peak FFT plot for ripple before LDO with 6.5 MHz
bandwidth; cursors at low frequency 200 kHz peak and nominal
switching frequency 1.5 MHz peak |
 FFT plot shown for FPWM ripple with 6.25 MHz
bandwidth; cursors at nominal switching frequency 1.5 MHz and first
harmonic 3 MHz peaks FFT plot shown for FPWM ripple with 6.25 MHz
bandwidth; cursors at nominal switching frequency 1.5 MHz and first
harmonic 3 MHz peaks |
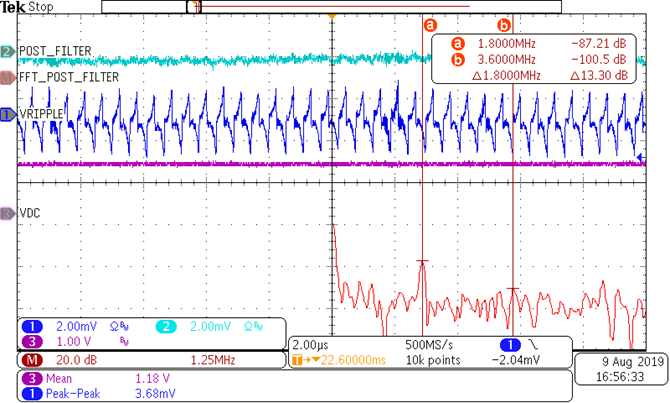
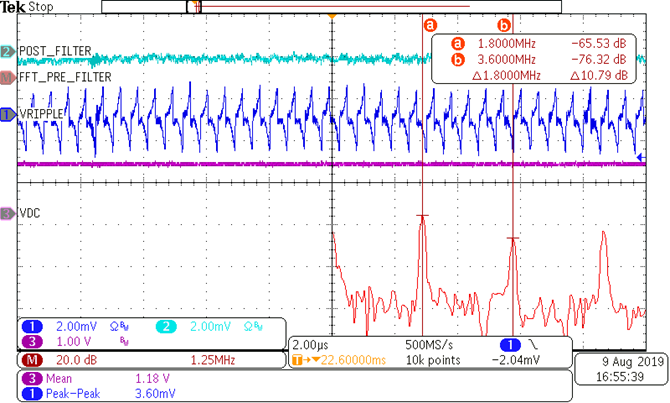 FFT plot for ripple before PI filter with 6.25 MHz
bandwidth; cursors at nominal switching frequency 1.8 MHz and first
harmonic 3.6 MHz peaks FFT plot for ripple before PI filter with 6.25 MHz
bandwidth; cursors at nominal switching frequency 1.8 MHz and first
harmonic 3.6 MHz peaks |
|
| Stage 2 Ripple | 7.6 mV | N/A | Noise Floor |
| 0.63% Accuracy | <0.01% Accuracy | ||
 FFT plot for ripple after LDO with 6.5 MHz
bandwidth; cursors in same spots showing expected 22 dB rejection by
TPS7A05 at 1.5 MHz FFT plot for ripple after LDO with 6.5 MHz
bandwidth; cursors in same spots showing expected 22 dB rejection by
TPS7A05 at 1.5 MHz |
 FFT plot for ripple after PI filter with 6.25 MHz
bandwidth; cursors in same spots showing ripple after PI filter
reaches noise floor of oscilloscope (85–90 dB) FFT plot for ripple after PI filter with 6.25 MHz
bandwidth; cursors in same spots showing ripple after PI filter
reaches noise floor of oscilloscope (85–90 dB) |
||
| Thermal Images Taken after 20 minutes on with 200 mA load current | 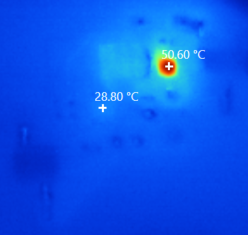 Infrared image showing TLV62568 heating to 28.8°C and TPS7A05 heating to 50.6°C after 20 minutes |
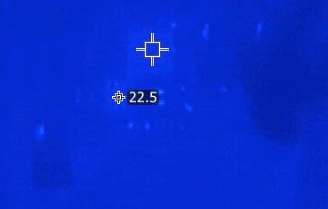 Infrared image showing TLV62568A heating to 22.5°C
after 20 minutes Infrared image showing TLV62568A heating to 22.5°C
after 20 minutes |
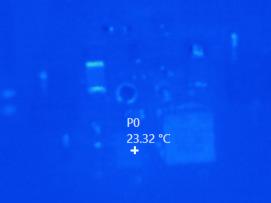 Infrared image showing TPS62841 heating to 23.3°C after 20 minutes |
| Transient - Switching Load (Square wave, 50uA-200mA, 1kHz) | |||
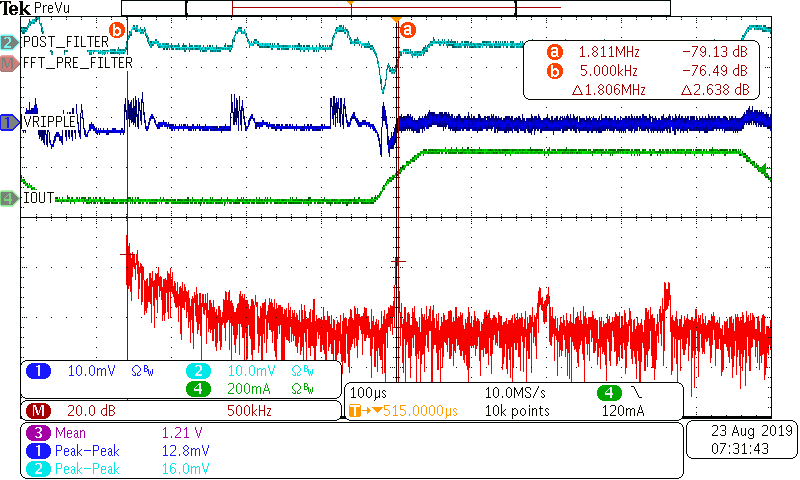
| Stage 1 Ripple | 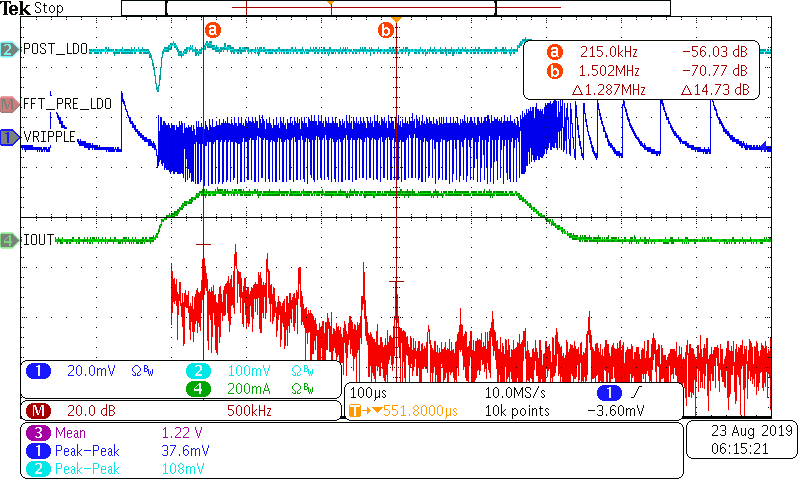 Dynamically changing operation mode (PFM-PWM-PFM)
with load change. FFT plot before LDO with 4 MHz bandwidth, showing
several frequency spikes as PFM frequency changes to PWM Dynamically changing operation mode (PFM-PWM-PFM)
with load change. FFT plot before LDO with 4 MHz bandwidth, showing
several frequency spikes as PFM frequency changes to PWM |
 Output ripple continues to be PWM as load changes,
with minimal overshoot and undershoot at load step. FFT plot with
2.5 MHz bandwidth shows ripple at 1.5 MHz, as expected Output ripple continues to be PWM as load changes,
with minimal overshoot and undershoot at load step. FFT plot with
2.5 MHz bandwidth shows ripple at 1.5 MHz, as expected |
 Dynamically changing operation mode (PFM-PWM) with
load change. FFT plot before PI filter with 4.25 MHz bandwidth,
showing ripple primarily at very low frequencies (PFM) and switching
frequency (1.8 MHz) Dynamically changing operation mode (PFM-PWM) with
load change. FFT plot before PI filter with 4.25 MHz bandwidth,
showing ripple primarily at very low frequencies (PFM) and switching
frequency (1.8 MHz) |
| Stage 2 Ripple | 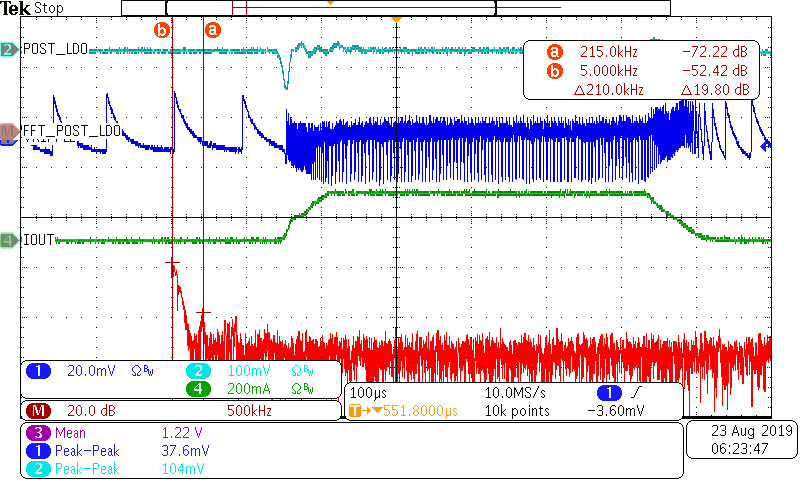 FFT plot after LDO with 4 MHz bandwidth shows higher
overshoot and undershoot values (low frequency) and strong noise
attenuation by LDO FFT plot after LDO with 4 MHz bandwidth shows higher
overshoot and undershoot values (low frequency) and strong noise
attenuation by LDO |
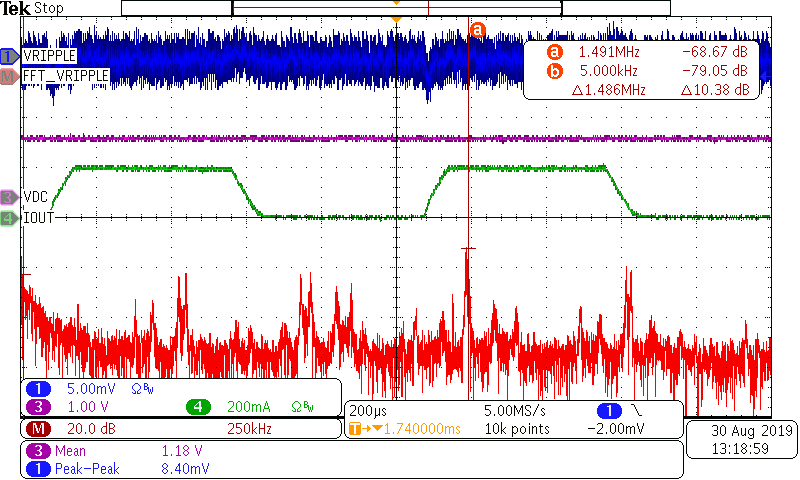
N/A | 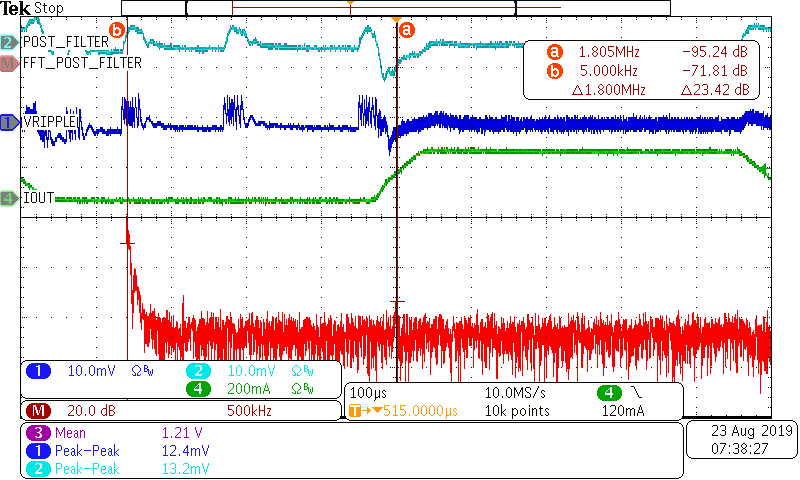 FFT plot after PI filter with 4.25 MHz bandwidth,
showing undershoot and overshoot present, though smaller than values
in Architecture A, and very strong noise attenuation by PI
filter FFT plot after PI filter with 4.25 MHz bandwidth,
showing undershoot and overshoot present, though smaller than values
in Architecture A, and very strong noise attenuation by PI
filter |
| Overshoot (at output of architecture) | 24 mV | 3 mV | 6 mV |
| Overshoot Settling Time | 125 µs | 60 µs | 166 µs |
| Undershoot (at output of architecture) | 76 mV | 3 mV | 8 mV |
| Undershoot Settling Time | 129 µs | 29 µs | 96 µs |