SLVAEX2 September 2020 – MONTH TPS55288 , TPS55288-Q1 , TPS552882 , TPS552882-Q1
2.3.3 Using Frequency Dithering Function
When the above various techniques for mitigating the generation of EMI fail to provide enough noise suppression, and fail the required EMI test, extra filtering and shielding is needed to further reduce the noise. But the typical filtering and shielding EMI solutions add significant cost, size and weight to the circuit, especially in the automotive applications which need to pass the strict CISPR25 level5 limit. For some electrical control unit (ECU), the filtering and shielding solution occupy a high percentage of the total cost. The application of spread-spectrum dithering offers a simple and cost effective solution for the average EMI noise reduction.
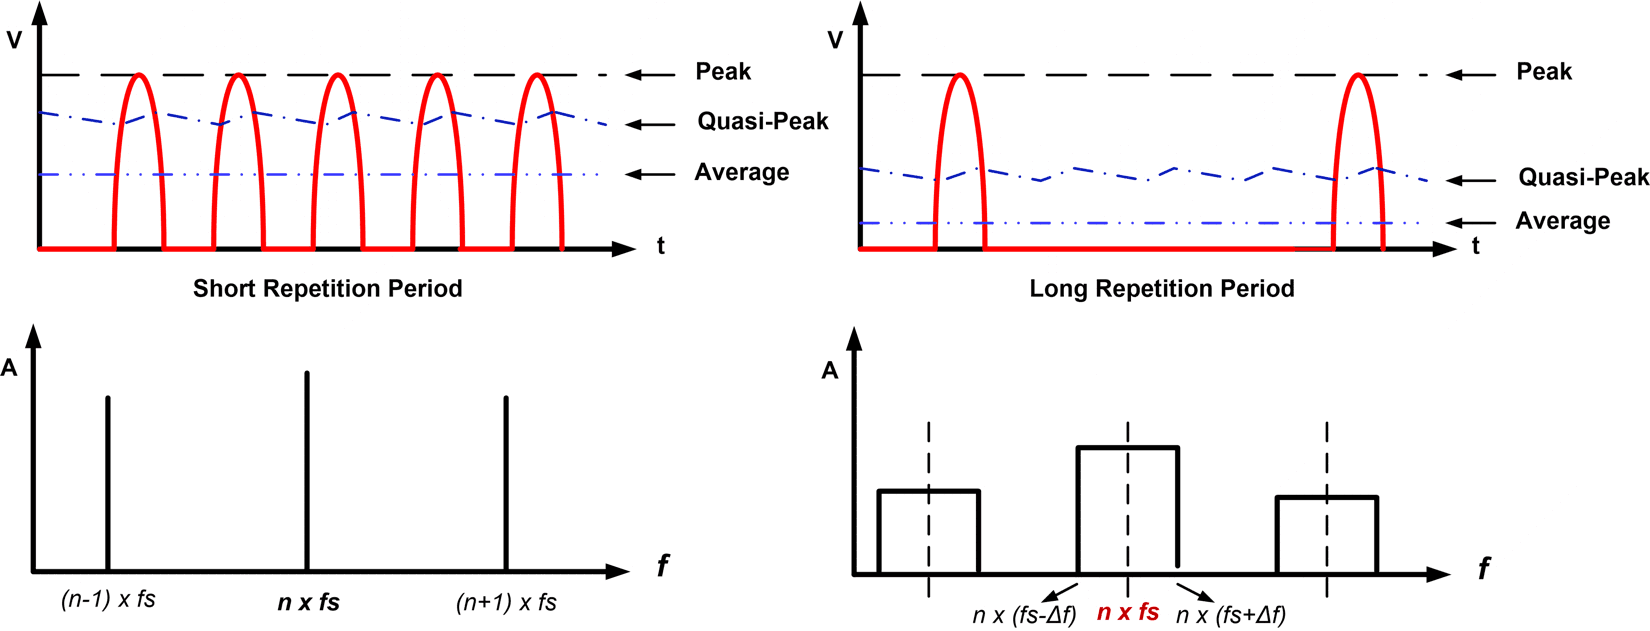
The aim of the frequency dithering is to spread out the harmonics of the switching frequency fs concentrated at multiple integers of fs to a broad brand noise, see waveform in figure 8. The EMI noise is periodical with respect to the switching frequency. The emission centers at the switching frequency and its nth harmonics. With frequency dithering, the fundamental frequency changes from fs-Δf to fs+Δf, its nth harmonic spread from nx(fs-Δf) to nx(fs+Δf). Hence the repetition of the fundamental frequency gets lower, so the measured quasi-peak and the average noise level gets lower, and the noise spectrum is broadened because of the side-band frequencies.
 Figure 2-8 Benefits of Frequency Dithering
Figure 2-9 shows the comparison waveform with and without frequency dithering. Without frequency dithering, the average noise level is 2dB above the limit. With frequency dithering, like what we analyzed above, the noise shape change to a broad-band noise spectrum and the average noise level gets far below the limit.
 Figure 2-9 Conduction EMI Comparison with
Frequency Dithering