SLVAFN0 august 2023 MSPM0C1105 , MSPM0C1106 , MSPM0H3216 , MSPM0L1306 , MSPM0L1343 , MSPM0L1346 , TPS8802
5 Test Results
The smoke tests that are performed for agency certification of smoke alarms specify thresholds where the alarm is expected to trigger an alarm within a certain time period after the threshold is crossed. These thresholds are specified in obscuration percentage per foot which is meant as a measure of the density of the smoke in the air and in turn how much the particles of that particular smoke has reduced the visibility in the room. A method used in photoelectric smoke detectors to correlate the signal measurement to obscuration is to compute the current transfer ratio (CTR) of the LED and photo diode pair (for example, photo diode current divided by LED drive current expressed in units of nA/mA).
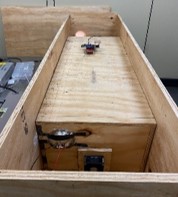
This demo was tested in a smoke box built to UL specifications as shown in Figure 5-1. The obscuration was measured using a calibrated reference meter.
 Figure 5-1 Smoke Box used for Demo
Testing
Figure 5-1 Smoke Box used for Demo
TestingTwo separate tests were performed. The first was using water vapor to simulate a nuisance source. The second added salt crystals to produce a simulated smoke signature in the smoke box. For both tests the IR LED drive current was set to 100mA and 50 mA for the Blue LED drive current. The PGA gain was set to 11 for the IR signal and 35 for the Blue signal in both tests. The measurements for these two tests are shown in Figure 5-2 and Figure 5-3, respectively.
 Figure 5-2 Water Vapor Test
Results
 Figure 5-3 Simulated Smoke Test
As shown in these results, this demo is capable of measuring different types of smoke. It is anticipated that the ratio of the IR to Blue photo diode measurements would provide the basis for a method to distinguish between the simulated smoke source and the water vapor source (considered to be a nuisance source, for example, shower steam) as shown in Designing a Dual-Ray Smoke Detector Analog Front-End With MSP430FR235x MCUs application note. In fact, an inspection of the results shown in Figure 5-2 and Figure 5-3 at obscuration rates of 2 %/ft and 4 %/ft, indicates ratios of 1.59 and 1.71 for water vapor and 2.93 and 3.08 for simulated smoke.
Also shown in these plots that when comparing the CTR numbers for a given Obscuration rate that the CTR for IR is much higher for the simulated smoke test compared to that of water vapor and also that the opposite is true for the CTR of Blue. This in agreement with theory in that the larger particles sizes in the simulated smoke will produce a larger scattering response for the IR wavelength and the smaller particle sizes in the water vapor will produce a larger scattering response in the Blue wavelength.