SNLA421 December 2022 DS320PR810 , SN75LVPE5412 , SN75LVPE5421
3.1 Effects of EQ Index on Time Domain Signal
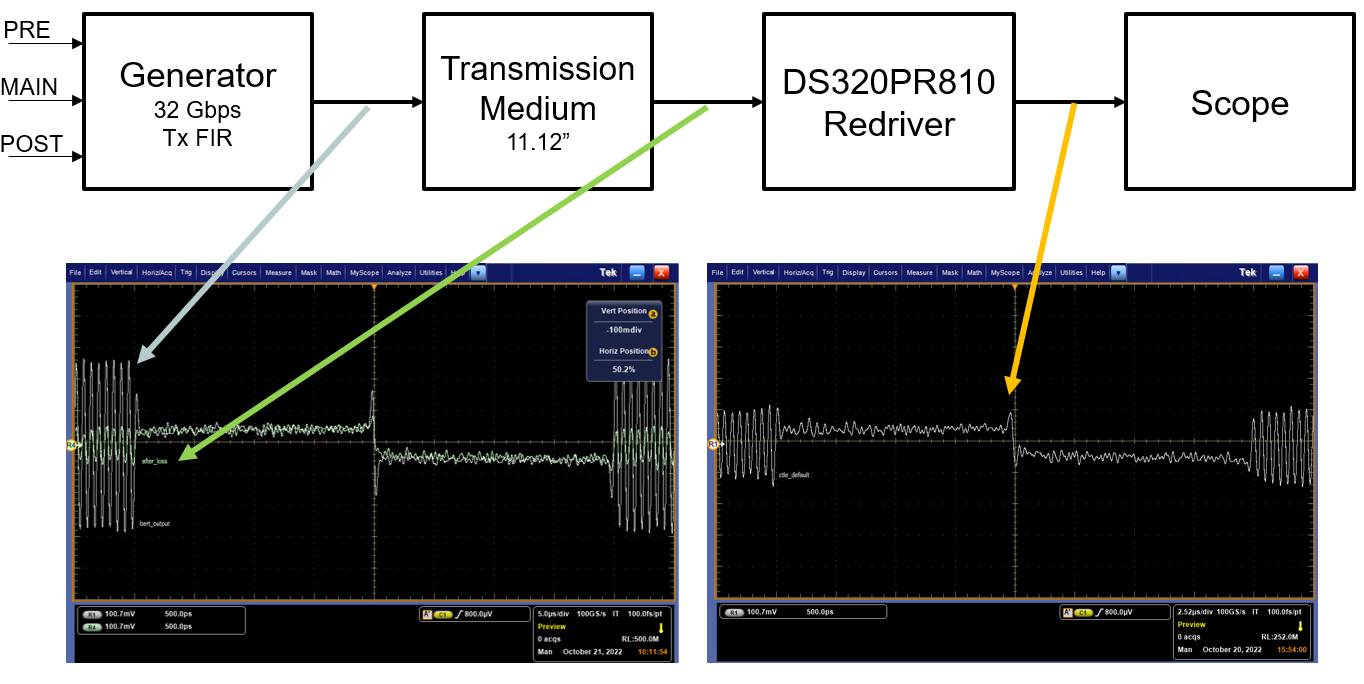
Ideally, there would be no difference between the waveform at the signal generator and after the redriver. Using a time domain overlay helps to paint a clear image of linear equalization at work. Examples of varying EQ Indices at 16GHz show the effect of equalization on the time domain signals in Figure 3-1. Note that DC Gain = 0dB for this figure.

Figure 3-1 Time Domain Signal After Generator, Loss Trace, and Redriver
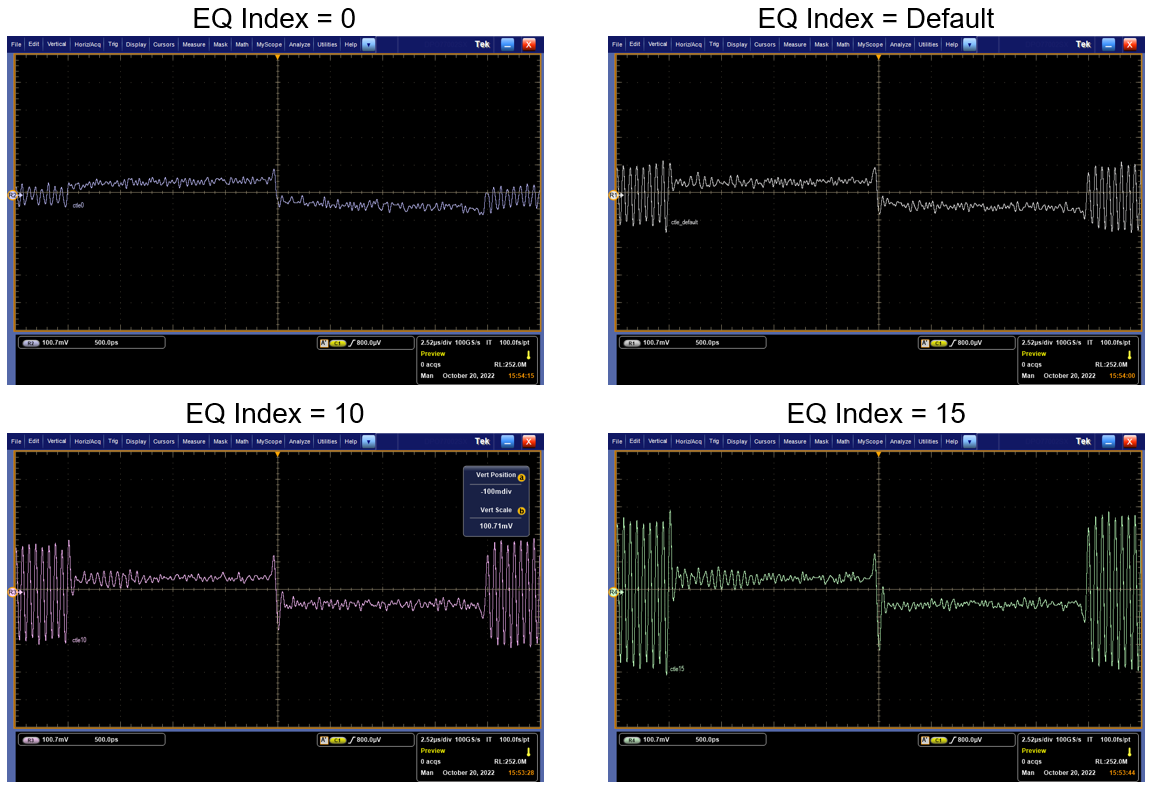
As shown in Figure 3-1, the time domain signal levels after the generator and after the redriver differ with an EQ Index of Default selected on the redriver. The following examples show the comparisons of time domain signals at the output of the redriver for EQ Indices of 0, Default, 10, and 15.

Figure 3-2 Time Domain Signal Comparison of EQ Index 0, Default, 10, 15
As shown in Figure 3-2, the amplitude of high-frequency components in the time domain signal are amplified as the EQ Index is increased. It is important to note that too large of an increase in the amplitude of the high frequency component of the time domain signal may not indicate the ideal eye opening at the output of the redriver. This process is highlighted in the following section.