SNLA421 December 2022 DS320PR810 , SN75LVPE5412 , SN75LVPE5421
2.2 Electrical Testing Results
Some of the most relevant testing is done with compliance software to measure at-speed electrical and eye performance. Table 2-2 and Table 2-3 shows system eye opening measurements after passing through the linear redriver.
| Equalization | Measured Value (ps) | Test Result | Margin (ps) | Low Limit (ps) |
|---|---|---|---|---|
| P0 Gen5 | 15.350 | Pass | 4.725 | 10.625 |
| P01 Gen5 | 15.831 | Pass | 5.206 | 10.625 |
| P02 Gen5 | 14.521 | Pass | 3.896 | 10.625 |
| P03 Gen5 | 14.770 | Pass | 4.145 | 10.625 |
| P04 Gen5 | 12.306 | Pass | 1.681 | 10.625 |
| P05 Gen5 | 17.315 | Pass | 6.690 | 10.625 |
| P06 Gen5 | 17.509 | Pass | 6.884 | 10.625 |
| P07 Gen5 | 17.655 | Pass | 7.030 | 10.625 |
| P08 Gen5 | 18.012 | Pass | 7.387 | 10.625 |
| P09 Gen5 | 18.311 | Pass | 7.686 | 10.625 |
| Equalization | Measured Value (mV) | Test Result | Margin (mV) | Low Limit (mV) |
|---|---|---|---|---|
| P0 Gen5 | 32.167 | Pass | 10.167 | 22 |
| P01 Gen5 | 30.724 | Pass | 8.724 | 22 |
| P02 Gen5 | 31.913 | Pass | 9.913 | 22 |
| P03 Gen5 | 33.157 | Pass | 11.157 | 22 |
| P04 Gen5 | 34.383 | Pass | 12.383 | 22 |
| P05 Gen5 | 41.763 | Pass | 19.763 | 22 |
| P06 Gen5 | 41.198 | Pass | 19.198 | 22 |
| P07 Gen5 | 32.055 | Pass | 10.055 | 22 |
| P08 Gen5 | 35.180 | Pass | 13.180 | 22 |
| P09 Gen5 | 41.540 | Pass | 19.540 | 22 |
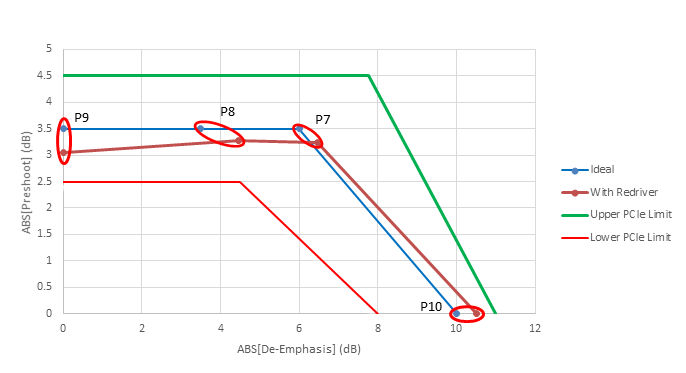
Another test which highlights linear redriver performance is the Tx Preset testing. This test uses the redriver test partner to generate each of the PCIe Tx presets P0 – P10. The ideal and measured values with the redriver are shown in Table 2-4. The performance of the redriver is based on its own linearity and the Tx performance of the test partner. Ideally the redriver will exactly emulate the test partner performance.
| Preset | Ideal Preshoot (dB) | Ideal De-Emphasis (dB) | Redriver Preshoot (dB) | Redriver De-Emphasis (dB) |
|---|---|---|---|---|
| P0 | 0 | -6 | 0.00 | -6.85 |
| P1 | 0 | -3.5 | 0.00 | -4.15 |
| P2 | 0 | -4.4 | 0.00 | -4.64 |
| P3 | 0 | -2.5 | 0.00 | -2.83 |
| P4 | 0 | 0 | 0.00 | 0.00 |
| P5 | 1.9 | 0 | 1.81 | 0.00 |
| P6 | 2.5 | 0 | 2.25 | 0.00 |
| P7 | 3.5 | -6 | 3.23 | -6.46 |
| P8 | 3.5 | -3.5 | 3.28 | -4.45 |
| P9 | 3.5 | 0 | 3.04 | 0.00 |
| P10 | 0 | -10 | 0.00 | -10.51 |
The Preset test is performed on a very low frequency portion of the compliance waveform. The test is run at such a low frequency to minimize PCB and cabling losses in the system. The lines use data from Presets P7 – P10 which form the perimeter of the Tx equalization space, other Presets use lower values of Preshoot and De-emphasis.

Figure 2-1 Graphical Representation of Tx Equalization