SNOA961A February 2017 – February 2023 LDC2112 , LDC2114 , LDC3114 , LDC3114-Q1
- Inductive Touch System Design Guide for HMI Button Applications
- 1Mechanical Design
- 2Sensor Design
- 3Summary
- 4Revision History
2.1.3 Sensor RP and RS
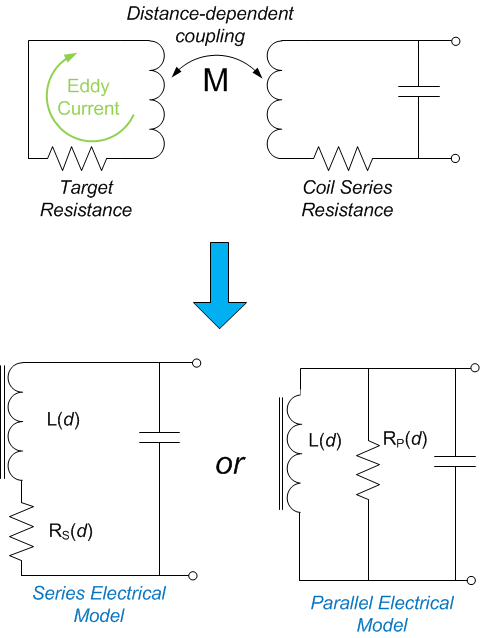
RP represents the parallel resonant impedance of the oscillator, and RS represents the series resonant impedance. These resistances are different representations of the same parasitic losses.
As conductive materials get closer to the sensor, the intensity of the eddy currents increases, which corresponds to larger losses in the sensor. The sensor RS is based on the series electrical model, while the RP is the based on the parallel electrical model, as shown in #T4726003-46. It is important to remember that these resistances are AC resistances, and not the DC resistances.
 Figure 2-1 Sensor Models
Use #X1756 to calculate the RP from the RS.

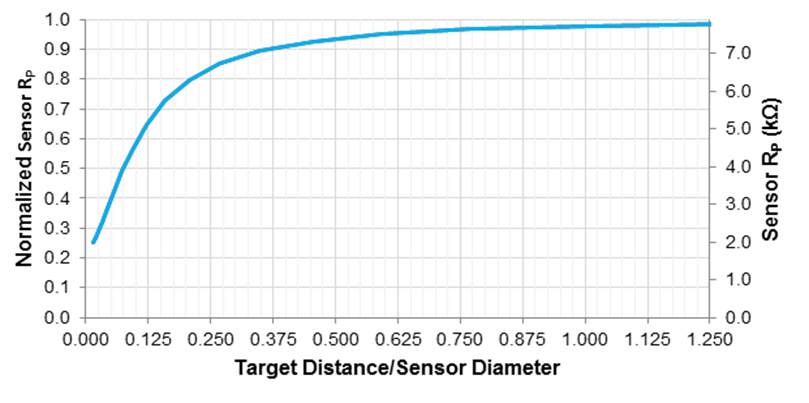
The Sensor RP decreases significantly as the conductive material is brought closer to the sensor surface, as seen in #T4726003-48. The example sensor response graphed in #T4726003-48 has an RP variation between 2 kΩ and 8 kΩ. This variation can be normalized response to apply to most sensors. If a 4-mm diameter sensor had a free space RP of 3 kΩ, the sensor would have a RP of approximately 2.2 kΩ if the distance to the conductive material was 0.5 mm.
It is possible that the sensor RP can be reduced to too low a level if the target is too close to the sensor. This condition must be avoided for proper functionality. Refer to GUID-6CCDCAA5-692E-46C8-89AE-7ED5549B7CFD.html#GUID-6CCDCAA5-692E-46C8-89AE-7ED5549B7CFD for more details.
 Figure 2-2 Example Sensor RP vs Target Distance