SNVAA88 December 2023 LM51581-Q1 , TPS1H000-Q1 , TPS92642-Q1
4.2 Margin Analysis Program Result
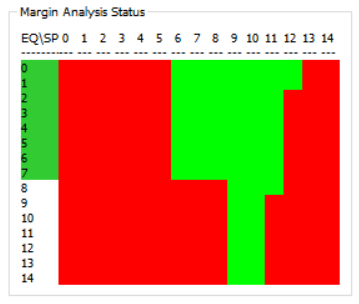
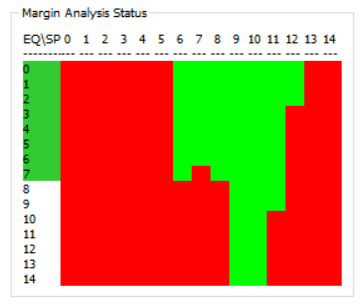
Margin Analysis Program (MAP) is used to evaluate the FPD-Link high-speed channel performance during the pulsing LED current. In MAP, the adaptive equalization process is disabled. The strobe position and equalization (EQ) level are set manually to create representations of the signal eye which can be used for system evaluation. The following two figures show the MAP result with and without pulsed LEDs.
Green areas indicate that for the given combination of EQ level and strobe position no bit errors have been detected. Red areas indicate where bit errors have been detected.
Figure 4-8 shows the MAP result without pulsing LEDs and Figure 4-8 shows the MAP result with pulsing LEDs. A comparison between both diagrams is showing insignificant differences in the results and therefore negligible impact on the FPD-Link communication from the pulsing LEDs.
 Figure 4-2 MAP result without pulsing LEDs Figure 4-2 MAP result without pulsing LEDs |  Figure 4-3 MAP result with pulsing LEDs Figure 4-3 MAP result with pulsing LEDs |
For more information on MAP, see Margin Analysis Program (MAP) and strobe positions for DS90UB954-Q1 and DS90UB960-Q1.