SPRADB8 may 2023 AM62A1-Q1 , AM62A3 , AM62A7
5 Core Loading
Processors in the AM6xA family have heterogeneous architectures with a variety of Arm® cores and hardware accelerators. Typical load tools, like ‘top’ in Linux, do not show the load on integrated microcontrollers or hardware accelerators.
The application under test is the Retail Checkout demo, which runs at around 15 fps with approximately 200 ms of latency per frame. This is bottlenecked primarily by application code written in Python3 for the CPU. The camera and object detection model, mobilenetv2SSD, can handle much higher framerate (up to 60). For a checkout scanner, 15 fps would be sufficient and will allow the developer to select a cost-down variant of the SoC.
In the 8.6 SDK, two methods for viewing core loads are supported:
- The tiperfoverlay gstreamer plugin, which draws bars along the bottom of the screen as in Figure 5-1
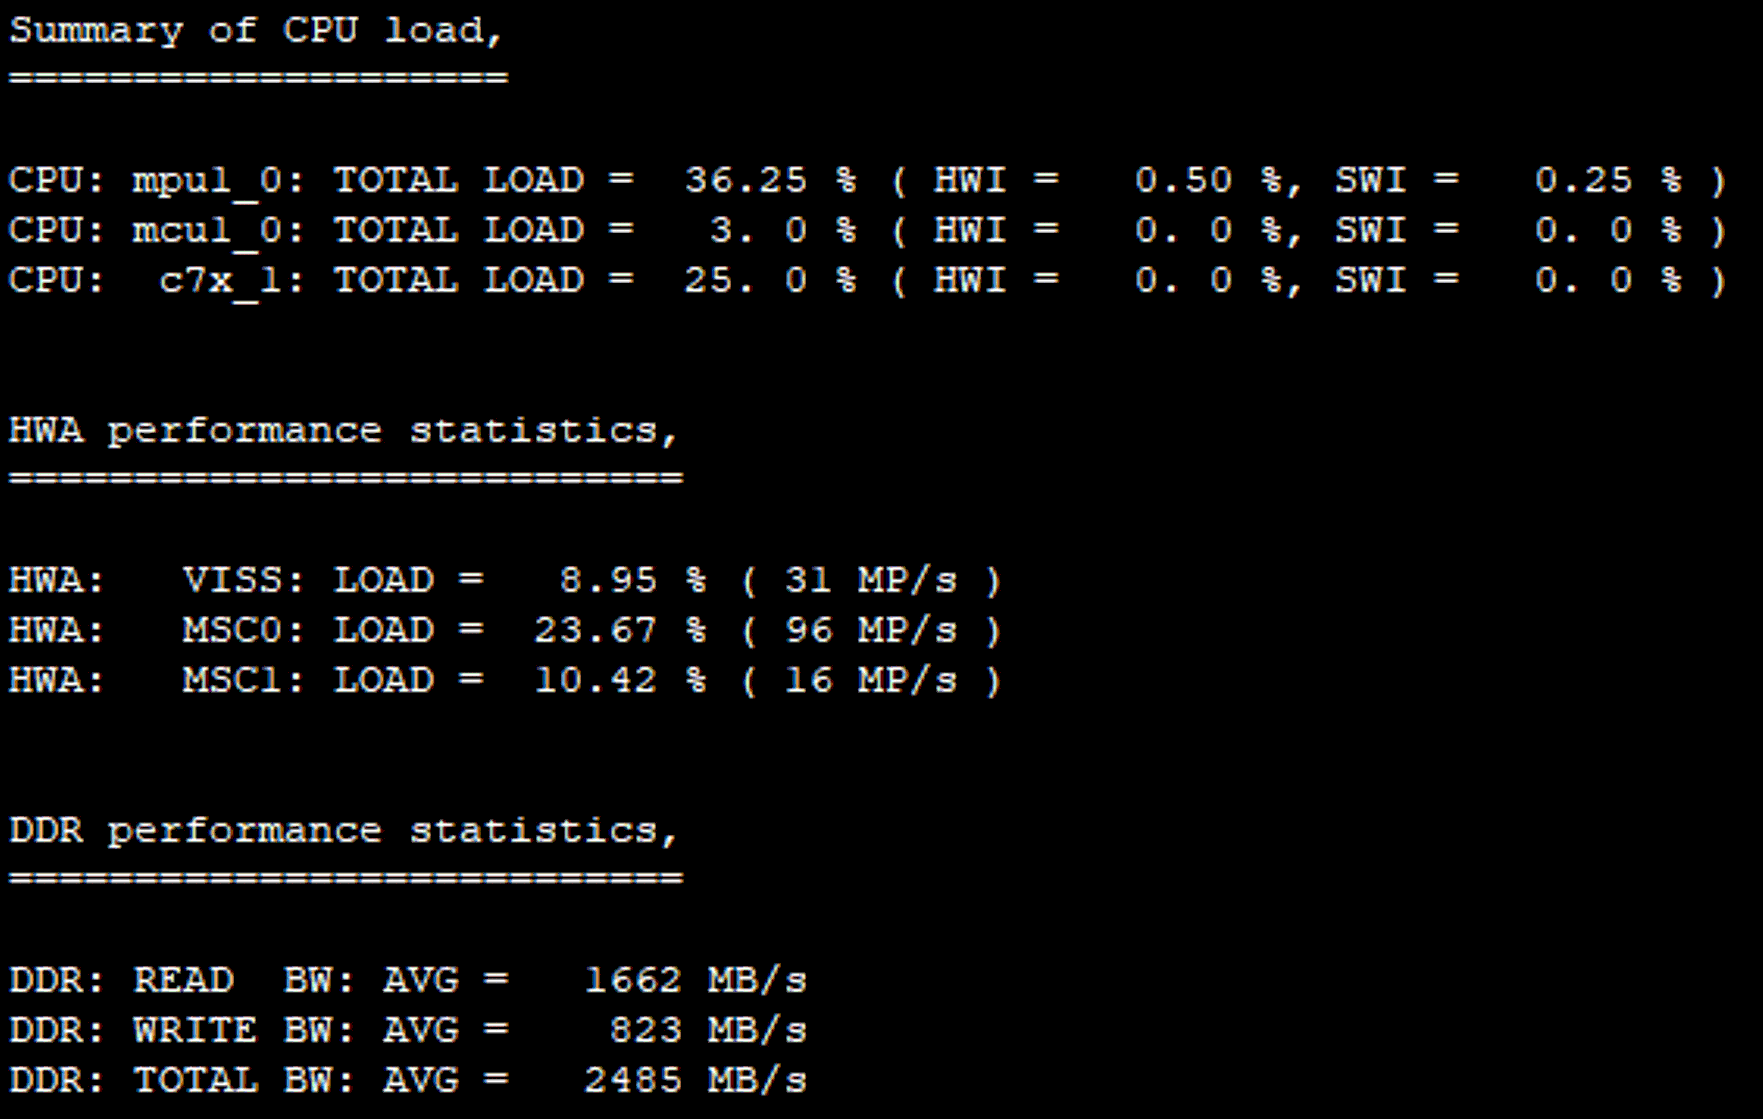
- The perf_stats command-line tool in Figure 5-2, which prints core loads to the terminal window.
Each of these have the same default update rate of 2 seconds. The tiperfoverlay plugin adds overhead to DDR and CPU for drawing information to the output frame. Out of box demos use tiperfoverlay by default. Note that the “MPU1_0” metric refers to the average CPU load on the A53 CPU cores.
 Figure 5-1 tiperfoverlay Gstreamer Plugin
When Running the Retail Checkout Demo
 Figure 5-2 perf_stats Command Line Core
Load When Running the Retail Checkout Demo
Figure 5-2 perf_stats Command Line Core
Load When Running the Retail Checkout DemoThere is slight variation between these two plots. For consistency, consider the A53 average load to be 35%, the C7x core load as 25% (running at max 1.7 TOPS for E2 EVM), ISP (VISS) is 10% and multiscaler engine (MSC) is average 17%. Note that in Figure 5-1, tiperfoverlay adds overhead for drawing performance information to the screen, which has a small impact on DDR usage.
For the MSC, the overall usage exceeds VISS because the vision pipeline has a split and merge; the performance impact is the summation of the inputs and outputs, which is within a few percent of the 115 MP/s expected for this gstreamer pipeline running at approx. 15 fps. The VPAC accelerator internally contains both MSC and the ISP (VISS); for this analysis consider overall VPAC usage to be 10%.
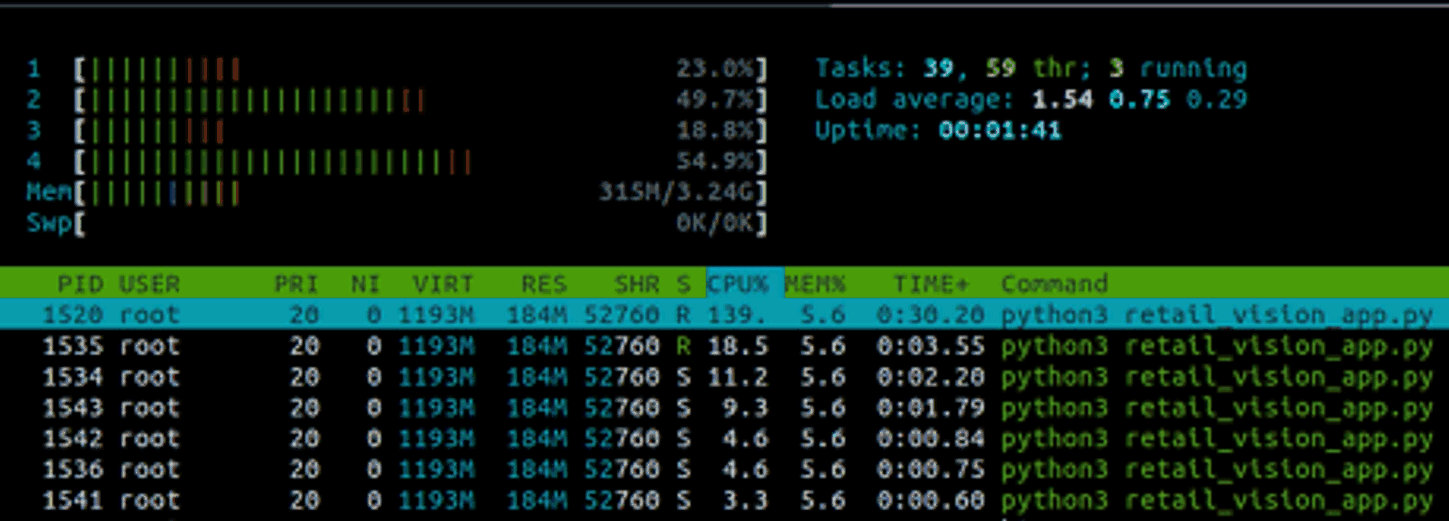
The DDR is 3200 MT/s and 32-bit, so total 2470 MB/s equates to roughly 20% usage, of which 30% are write transfers. To see how much memory is currently used within userspace, the ‘htop’ linux utility (see Figure 5-3) is helpful. From this, only around 315 MB is used within the OS. Note the 3.24 GB maximum – this is what remains of the 4 GB LPDDR module on the EVM after carveouts for the Linux kernel and HW accelerators. For example, the C7xMMA is allocated 256 MB by default in the 8.6 Processor SDK Linux. Given this memory usage, a cost-optimized system can use 1.5 GB of DDR, perhaps as low as 1 GB with more optimizations to the Linux image to remove unused services and packages.
 Figure 5-3 Retail Checkout Demo Load
Using 'htop' Linux Utility