SSZT666 July 2018 TUSB1002 , TUSB1002A
Signal integrity, the measure of electrical signal quality, can be visualized by displaying a signal waveform on an oscilloscope. This visualization is commonly known as an eye diagram, and is generated by overlaying the waveform’s positive and negative bits. When superimposed, these bits produce an image that resembles an open eye, hence the name “eye diagram”.
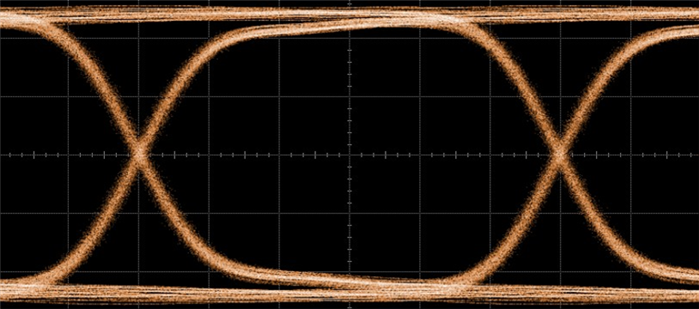
Eye diagrams are a useful tool during system design as they can help determine if a high speed interface requires a signal conditioner. They can also reveal the amount of signal jitter and distortion present as well as help measure the signal-to-noise ratio. Figure 1 shows an ideal eye diagram - one without loss or noise.
 Figure 1 Eye diagram of a signal
without channel loss
Figure 1 Eye diagram of a signal
without channel lossNow that you have a basic understanding of eye diagrams, let's explore what this visualization means for your system design and - ultimately - if the results may indicate whether or not your high speed interface needs a signal conditioner.
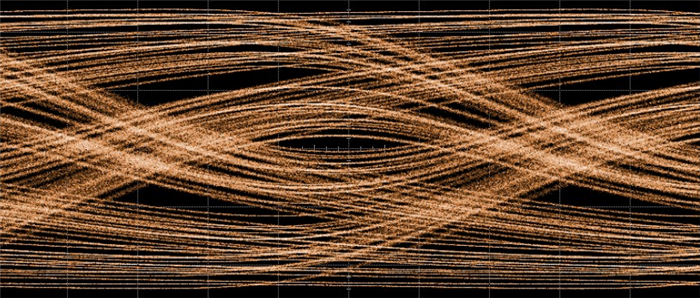
We will focus on USB for this example. USB speeds have increased in recent years from 1.5Mbps to 10Gbps to satisfy ever-increasing bandwidth needs. However, this increase is not without complications. For example, when high-speed signals traverse through long channels (e.g. cables), the transmission media will introduce frequency-dependent losses; in other words, the high-frequency components of a signal will suffer more loss than the low-frequency components. This also influences the width of bit intervals since higher speed equates to smaller bit intervals. Understanding these distinctions is useful for identifying potential issues. For example, one bit might interfere with a subsequent bit, resulting in distortion of the bit waveform, which is known as intersymbol interference. When visualized, this signal distortion can create a “closed” eye diagram, resulting in significant bit errors that cannot be recovered properly at the receiver end (Figure 2).
 Figure 2 A closed eye diagram with a
USB3 10Gbps signal over a 12-inch printed circuit board (PCB) trace
Figure 2 A closed eye diagram with a
USB3 10Gbps signal over a 12-inch printed circuit board (PCB) traceBased on the result in Figure 2, this interface would likely benefit from a signal conditioner, such as a redriver.
A redriver is a type of signal conditioner that can compensate for channel losses caused by intersymbol interference. The TUSB1002A is a USB 3 10Gbps linear redriver that can provide up to 16dB of equalization to clean up the signal. Using the same setup as Figure 2, the TUSB1002A can be placed at the end of an 8-inch trace with a 4-inch post channel (Figure 3).
 Figure 3 Adding the TUSB1002A Redriver
In-between the PCB Trace to Compensate for Channel Loss and Create an Open Eye
Diagram
Figure 3 Adding the TUSB1002A Redriver
In-between the PCB Trace to Compensate for Channel Loss and Create an Open Eye
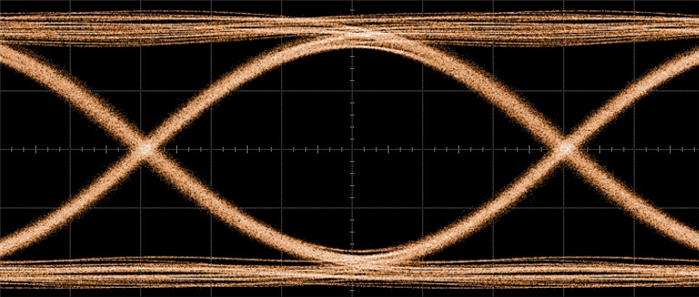
DiagramWith this setup, you can expect to see an open eye diagram (Figure 4). This indicates excellent signal quality with very little jitter as a result of adding a signal conditioner in between the PCB trace. With the TUSB1002A in the system, the USB3 port can pass USB compliance, restore signal fidelity, and enable better system interoperability with other USB devices.
 Figure 4 An Open Eye Diagram after the
Placement of the TUSB1002A
Figure 4 An Open Eye Diagram after the
Placement of the TUSB1002AIn this example, the TUSB1002A serves as a USB3 signal conditioner, or a shortener over a channel to provide equalization gains, compensating for frequency-dependent channel loss without altering channel characteristics. Any applications with a USB3 port that have signal-integrity issues can benefit from the TUSB1002A at 10Gbps and 5Gbps by ensuring a USB3 compliant port - including personal electronics, industrial, communication and enterprise systems, as well as automotive applications.
Additional Resources
Download our TUSB1002A technical resources for more information: