TIDT223 April 2021
3.1 EMI
Conducted summary: This is for an application where a system-level common-mode inductor impedance of 700 Ω at 100 MHz already exists and the primary- to secondary-stitch capacitance in the PCB inner layers of 11 pF is allowed under the isolated 5-V to 5-V converter. Both the stitch capacitor of 11 pF plus the added Y capictor of approximately 50 pF, as in the case of configuration A, allows the passing of conducted through 108 MHz, but barely, by only one dB. Roughly doubling the Y cap value gives good passing margin of > 4 dB. Using a 220 pF through-hole Y cap as in configuration B on the top side gives even more margin, approximately 8 dB. Most runs were done in the 30 MHz–108 MHz range where noise came close to the limits. The first and last configurations were also done in the 150 kHz–30 MHz range to show passing by a wide margin in that range. The conductive scans that are summarized above are shown in the following images.
EMI conducted scans from RED LISN: December 9, 2020
PMP22845 Configuration A; Again this configuration utalizes two 100 pF “1812” size capacitors in series for effective 50 pF.
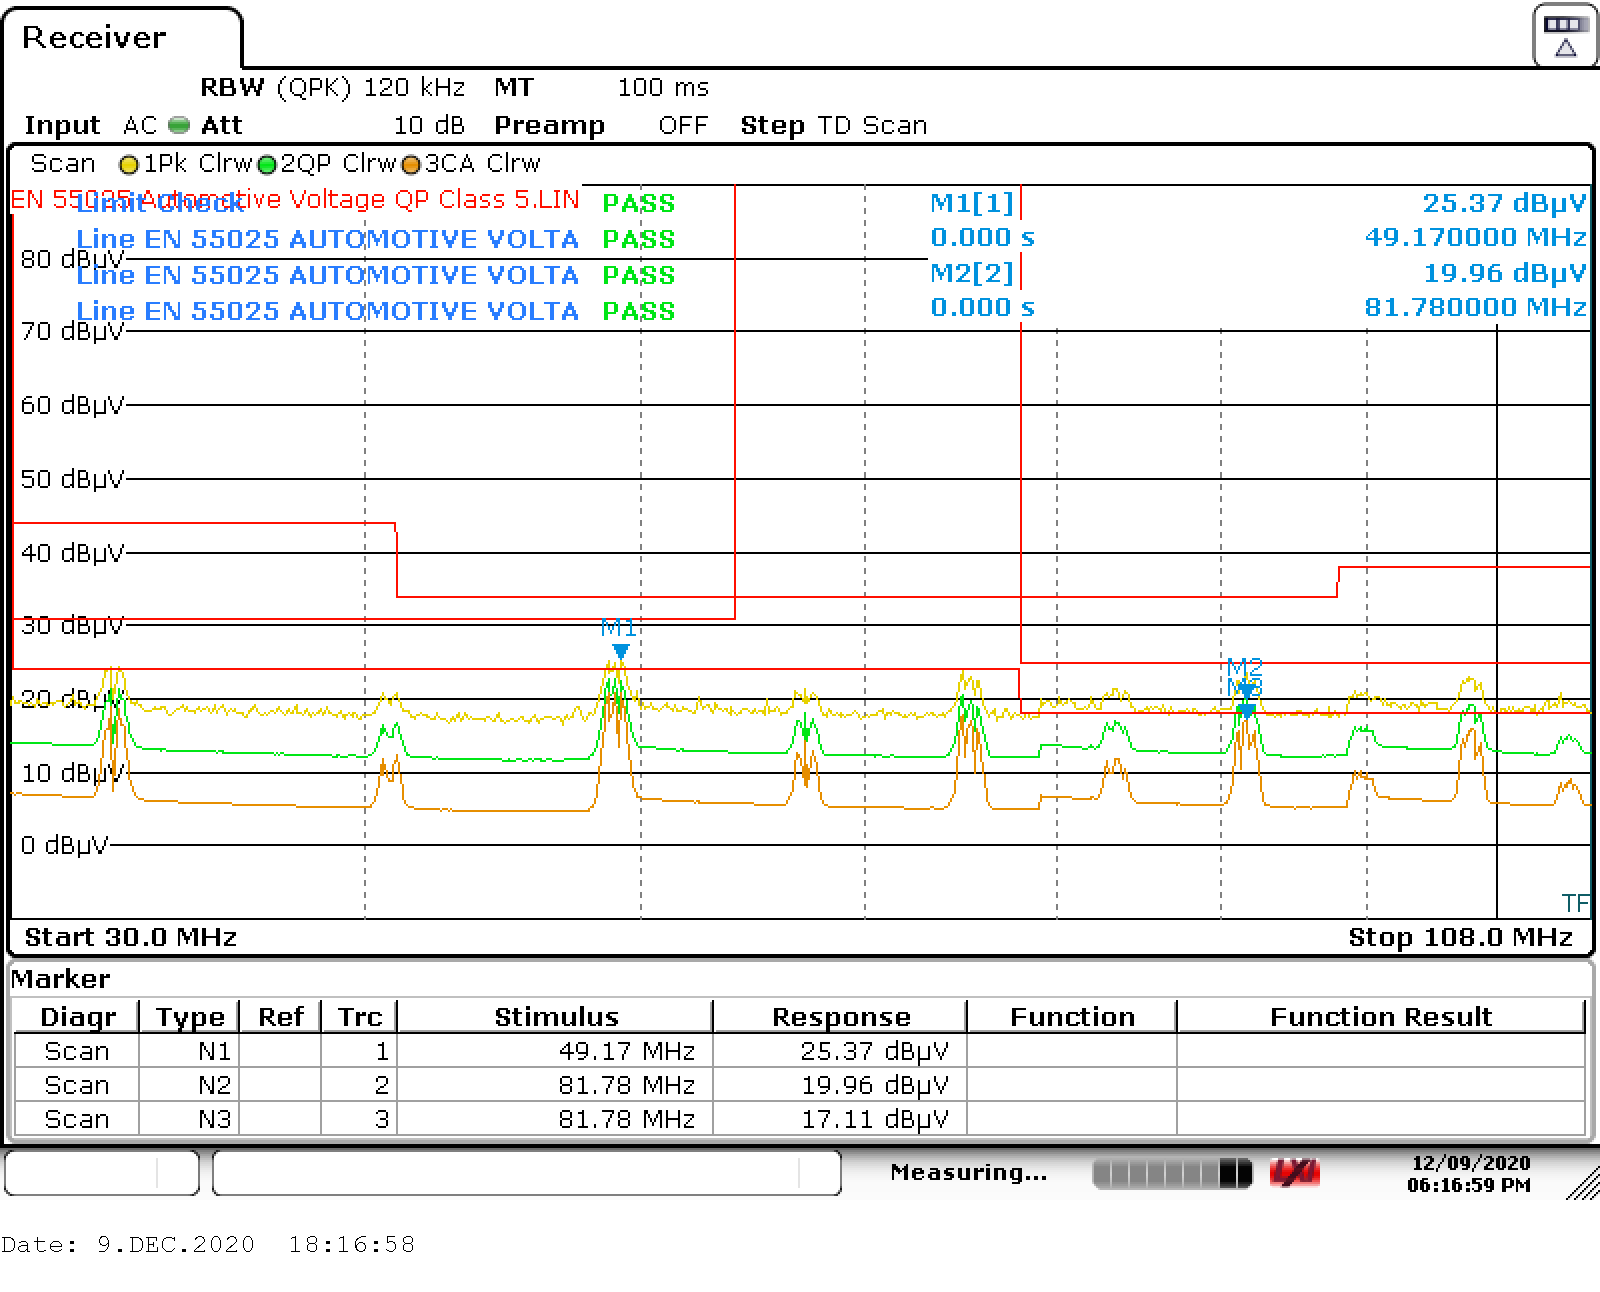
Peak detect: Passes with greater than 8-dB margin. Worst case 49 MHz.
Quasi-Peak (QP) detect: 5-dB margin, worst case 82 MHz.
CISPR average (CA) detect: 0.9-dB margin, worst case 82 MHz.
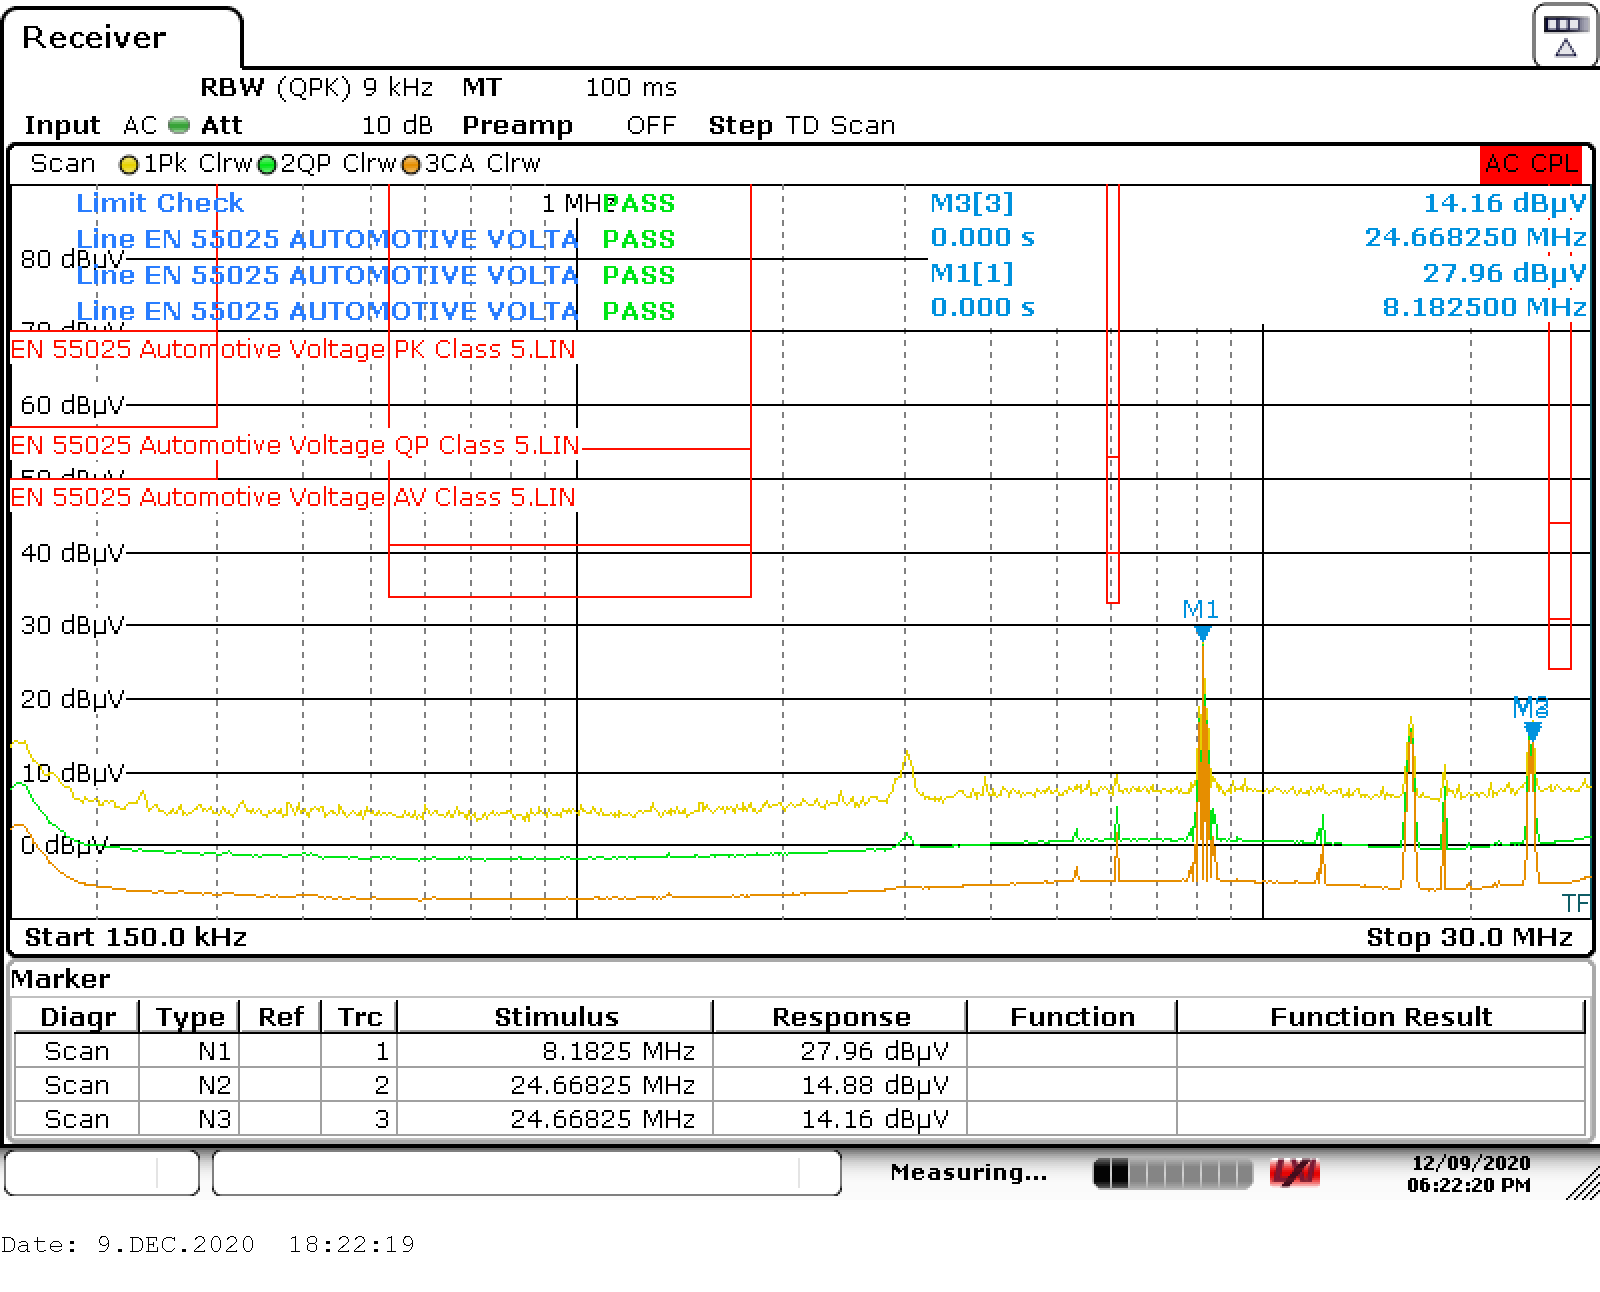 Figure 3-2 Conducted Configuration A,
150 kHz–30 MHz Range
Figure 3-2 Conducted Configuration A,
150 kHz–30 MHz RangePMP22845 Configuration A; Again this configuration utalizes two 220 pF through-hole capacitors in series for effective 110 pF.
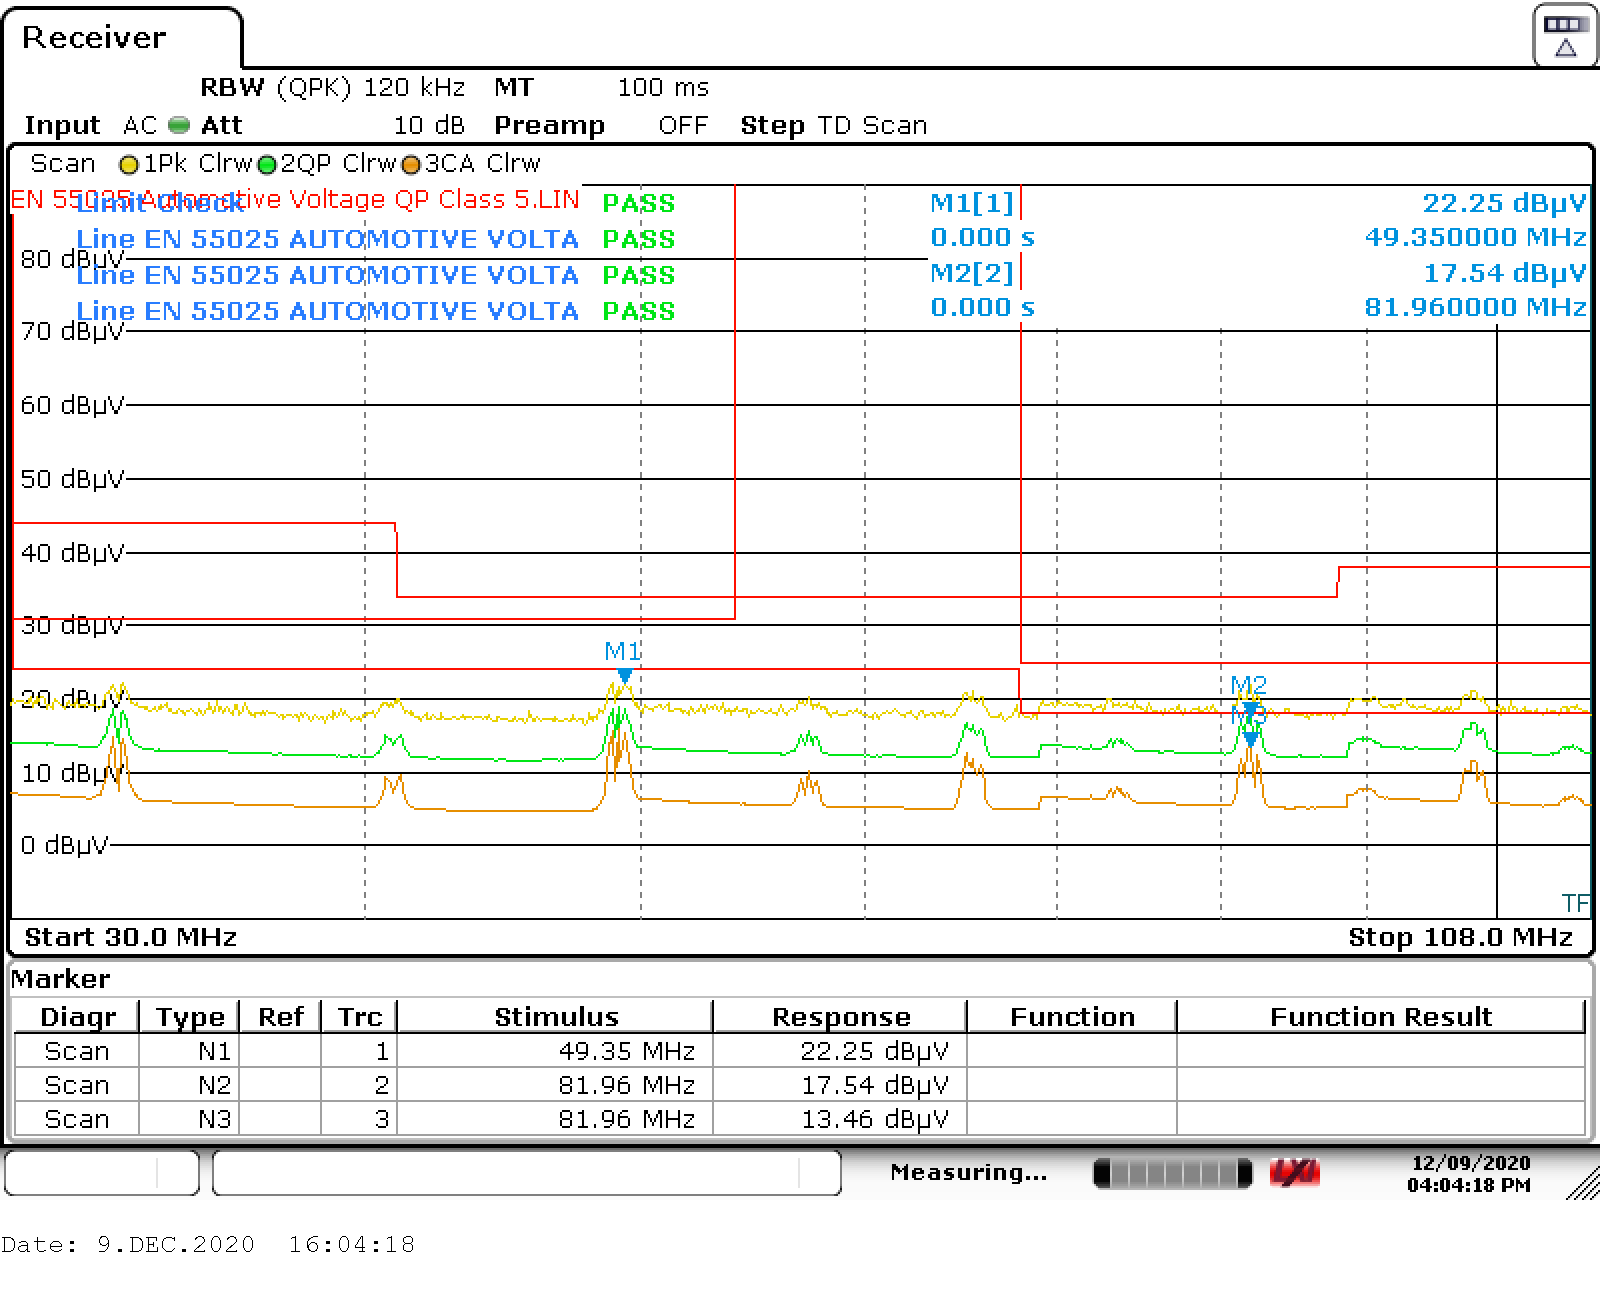
Peak detect: Passes with greater than 11-dB margin. Worst case 49 MHz.
Quasi-Peak (QP) detect: Passes with 7.5-dB margin. Worst case 82 MHz.
CISPR average (CA) detect: Passes with 4.5-dB margin. Worst case 82 MHz.
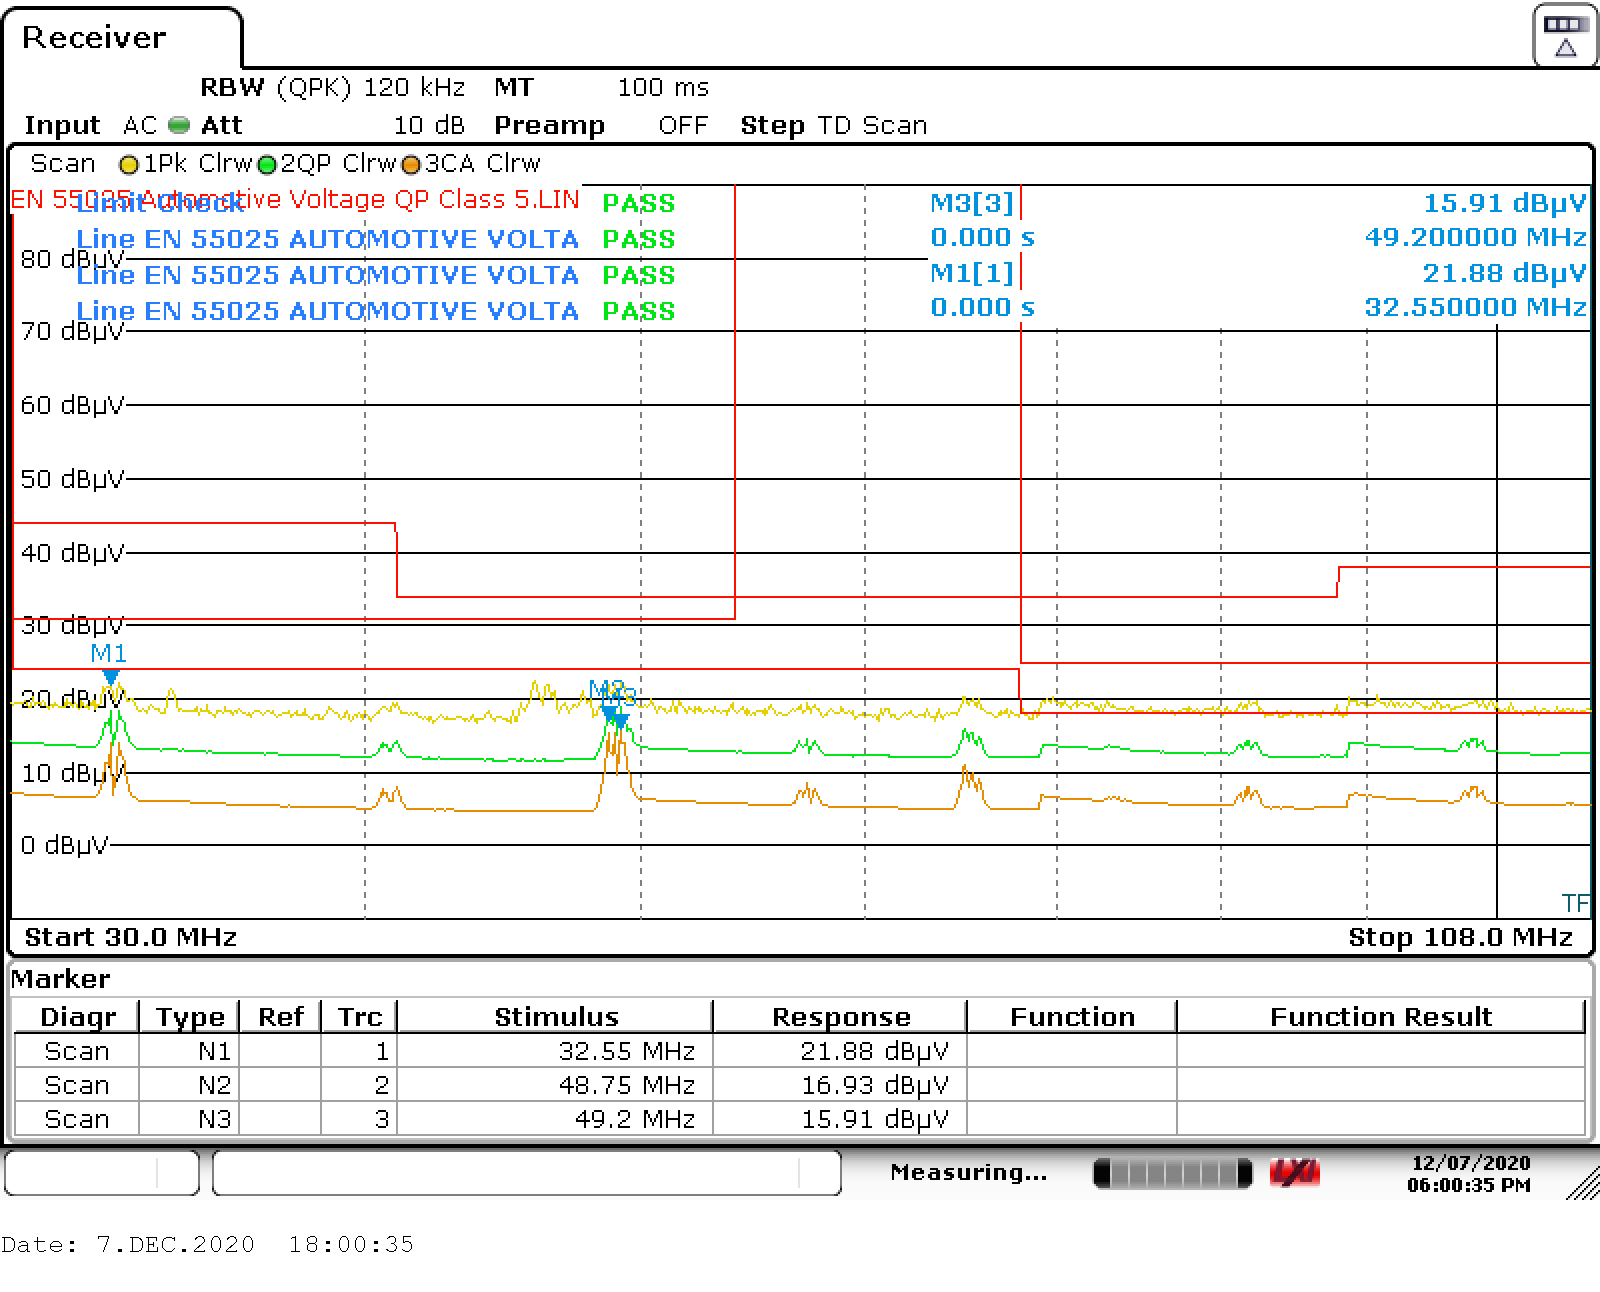
Peak detect: Passes with greater than 12-dB margin.
Quasi-Peak (QP) detect: Passes with greater than 8-dB margin.
CISPR average (CA) detect: Passes with 8-dB margin. Worst case at 49 MHz.
Same as previous, but full conducted spectrum down to 150 kHz: No large peaks below 30 MHz.
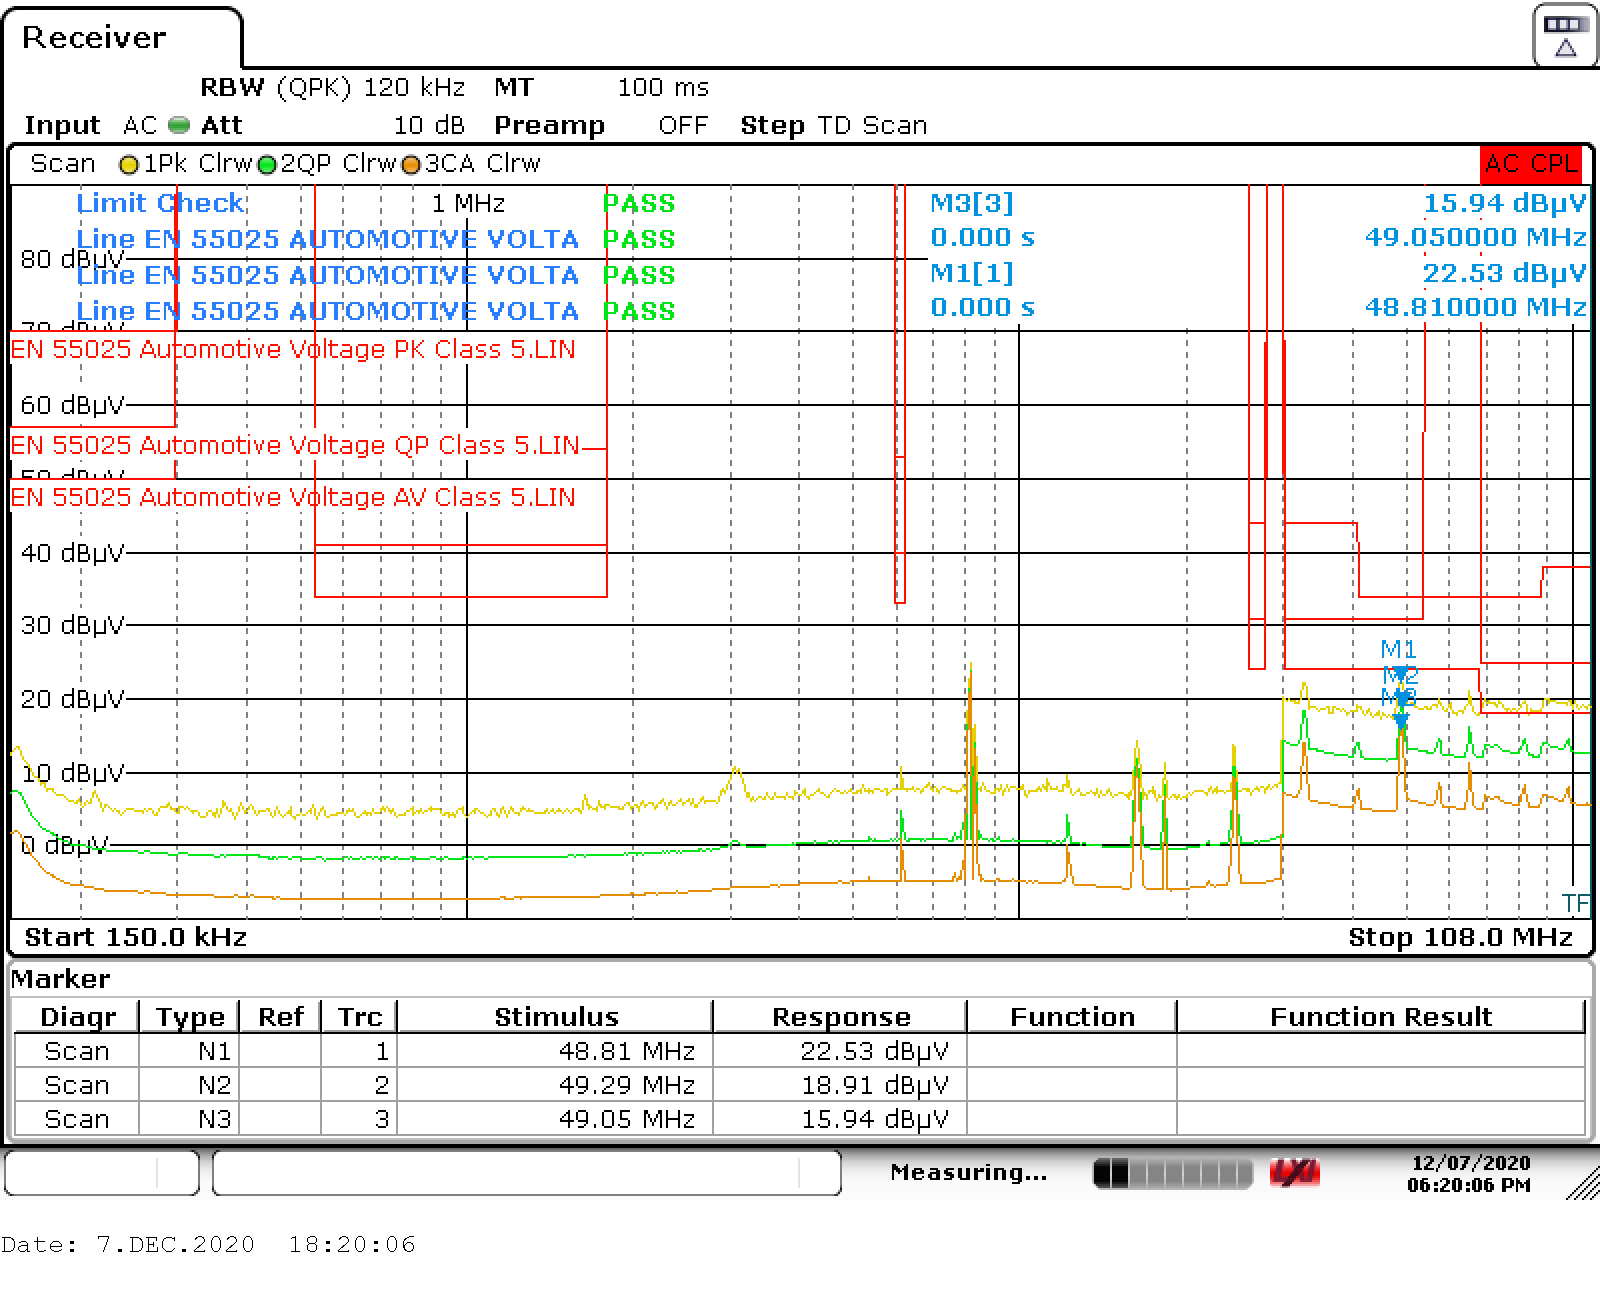 Figure 3-5 Conducted Board Configuration B, 150 kHz–108 MHz Range
Results Summary
Radiated testing at NTS December 2020 – Summary
PMP22845 (with stitching 11-pF cap primary ground to secondary ground at UCC12051-Q1) models were used.
Input filter off battery had 700 Ω (at 100 MHz) common mode filter plus differential mode Pi filter.
Added Y cap from primary ground to secondary ground under UCC12051-Q1 was 2 × 100 pF size 1812 caps in series to gap the 8-mm spacing between primary ground and secondary ground for an effective cap of 50 pF on configuration A of PMP22845. This previously passed conducted emissions with only one dB margin.
In general, conducted testing proved to be more severe than radiated for CISPR 25 Class 5.
Low frequency range 150 kHz–30 MHz with monopole never got within 6dB of the limits, even with the 3rd harmonic of the 8 MHz UCC12051-Q1 switching with maximum average being 1.5 dBuV versus the specification of 20 dBuV maximum in the 26–28 MHz range. See next page.
Mid-band of 30–300 MHz with biconical antenna is considered the range of greatest risk and had the greatest test focus. Configuration A passed by at least 10 dB. Antenna horizontal and vertical orientations gave similar results. See following two pages.
High band 200–1000 MHz range: Worst cases around 240 MHz and 800–900 MHz, but still passing with 7 dB at 240 MHz and > 10 dB in the 800–900 MHz range. The 7-dB margin at 240 MHz may be due to the noise floor, as passing at this frequency with biconical antenna was with > 10 dB. CISPR 25 allows either biconical or log periodic antenna in the 200–300 MHz range. See following figures.
Radiated low frequency 150 kHz–30 MHz range with vertical monopole: Worst of the runs with PMP22845 Configuration A: 24.7 MHz average still 18.5 dB below CB band average limit of 20 dBuV/m.
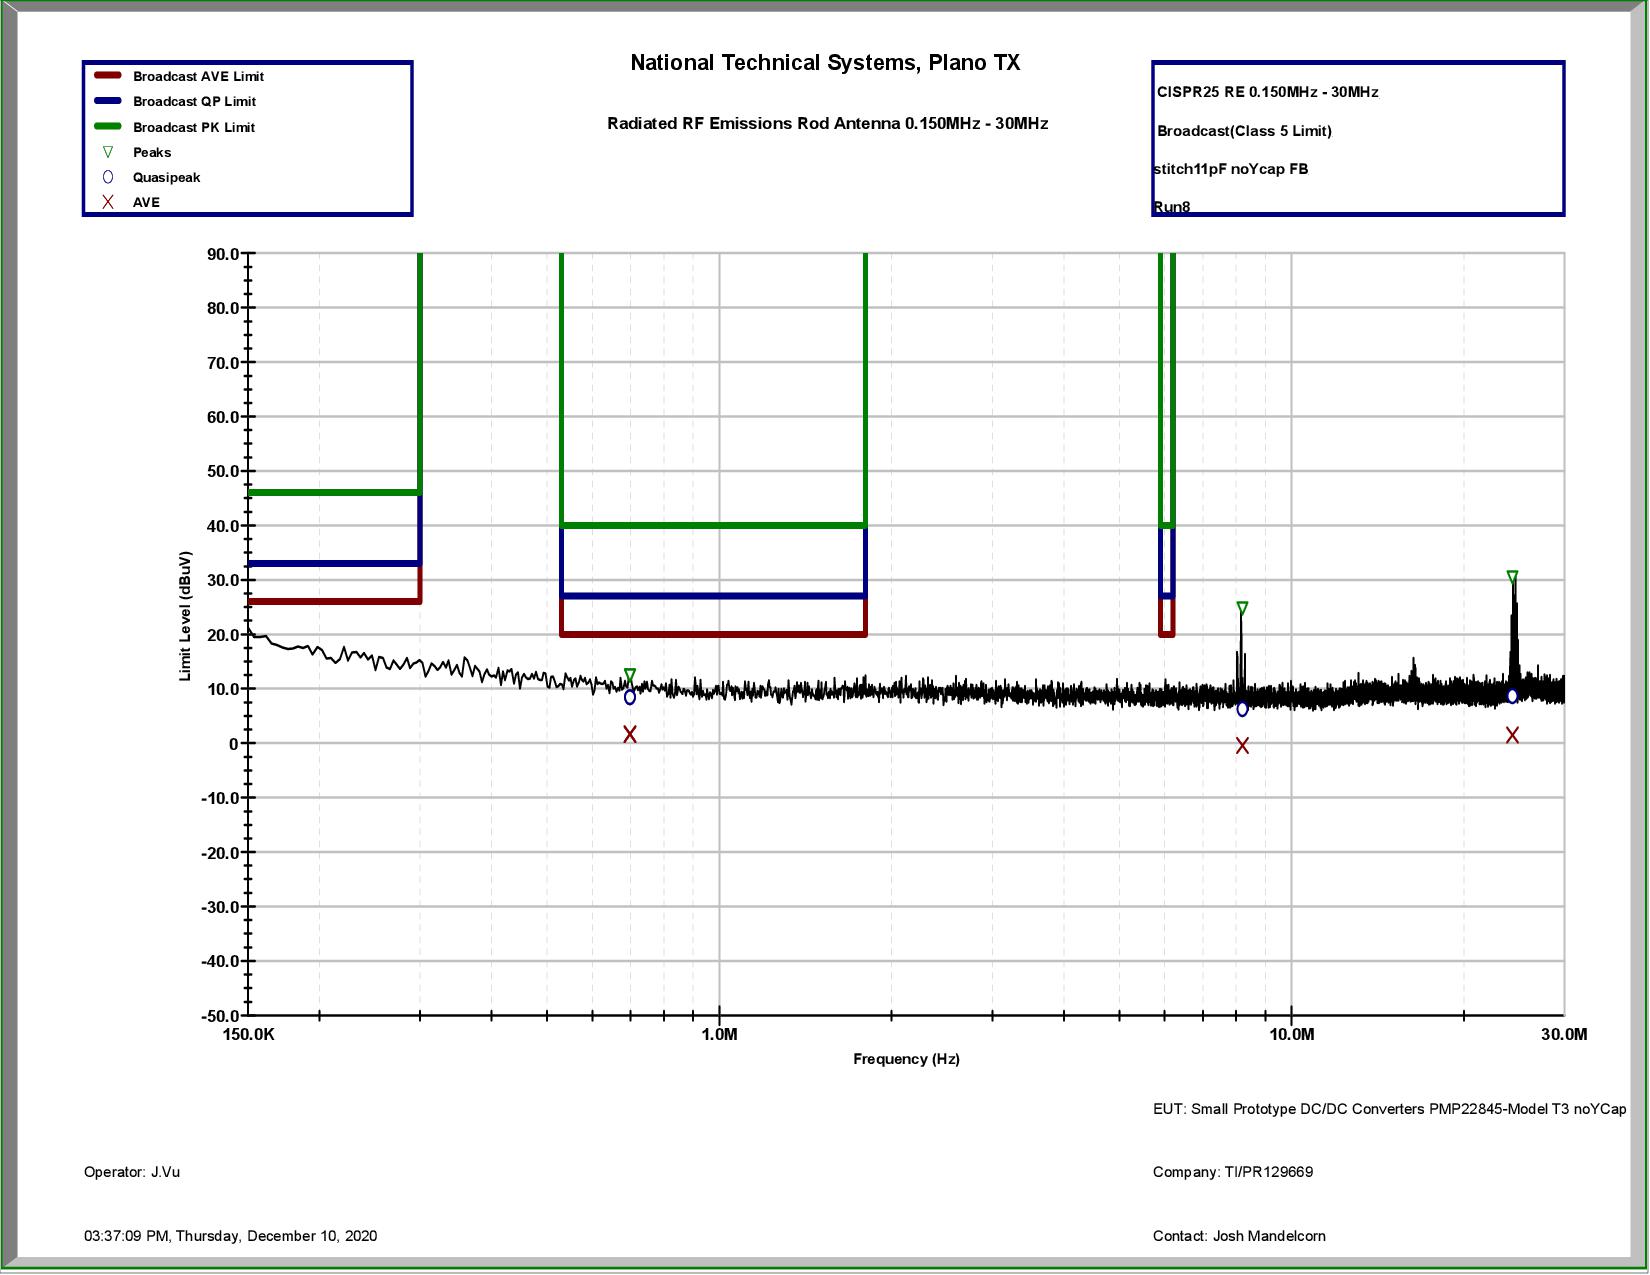 Figure 3-6 150 kHz–30 MHz Range With
Vertical Monopole
Figure 3-6 150 kHz–30 MHz Range With
Vertical MonopoleRadiated mid-band 30–300 MHz range with horizontal biconical: Worst of runs with PMP22845 Configuration A: Other runs very similar.
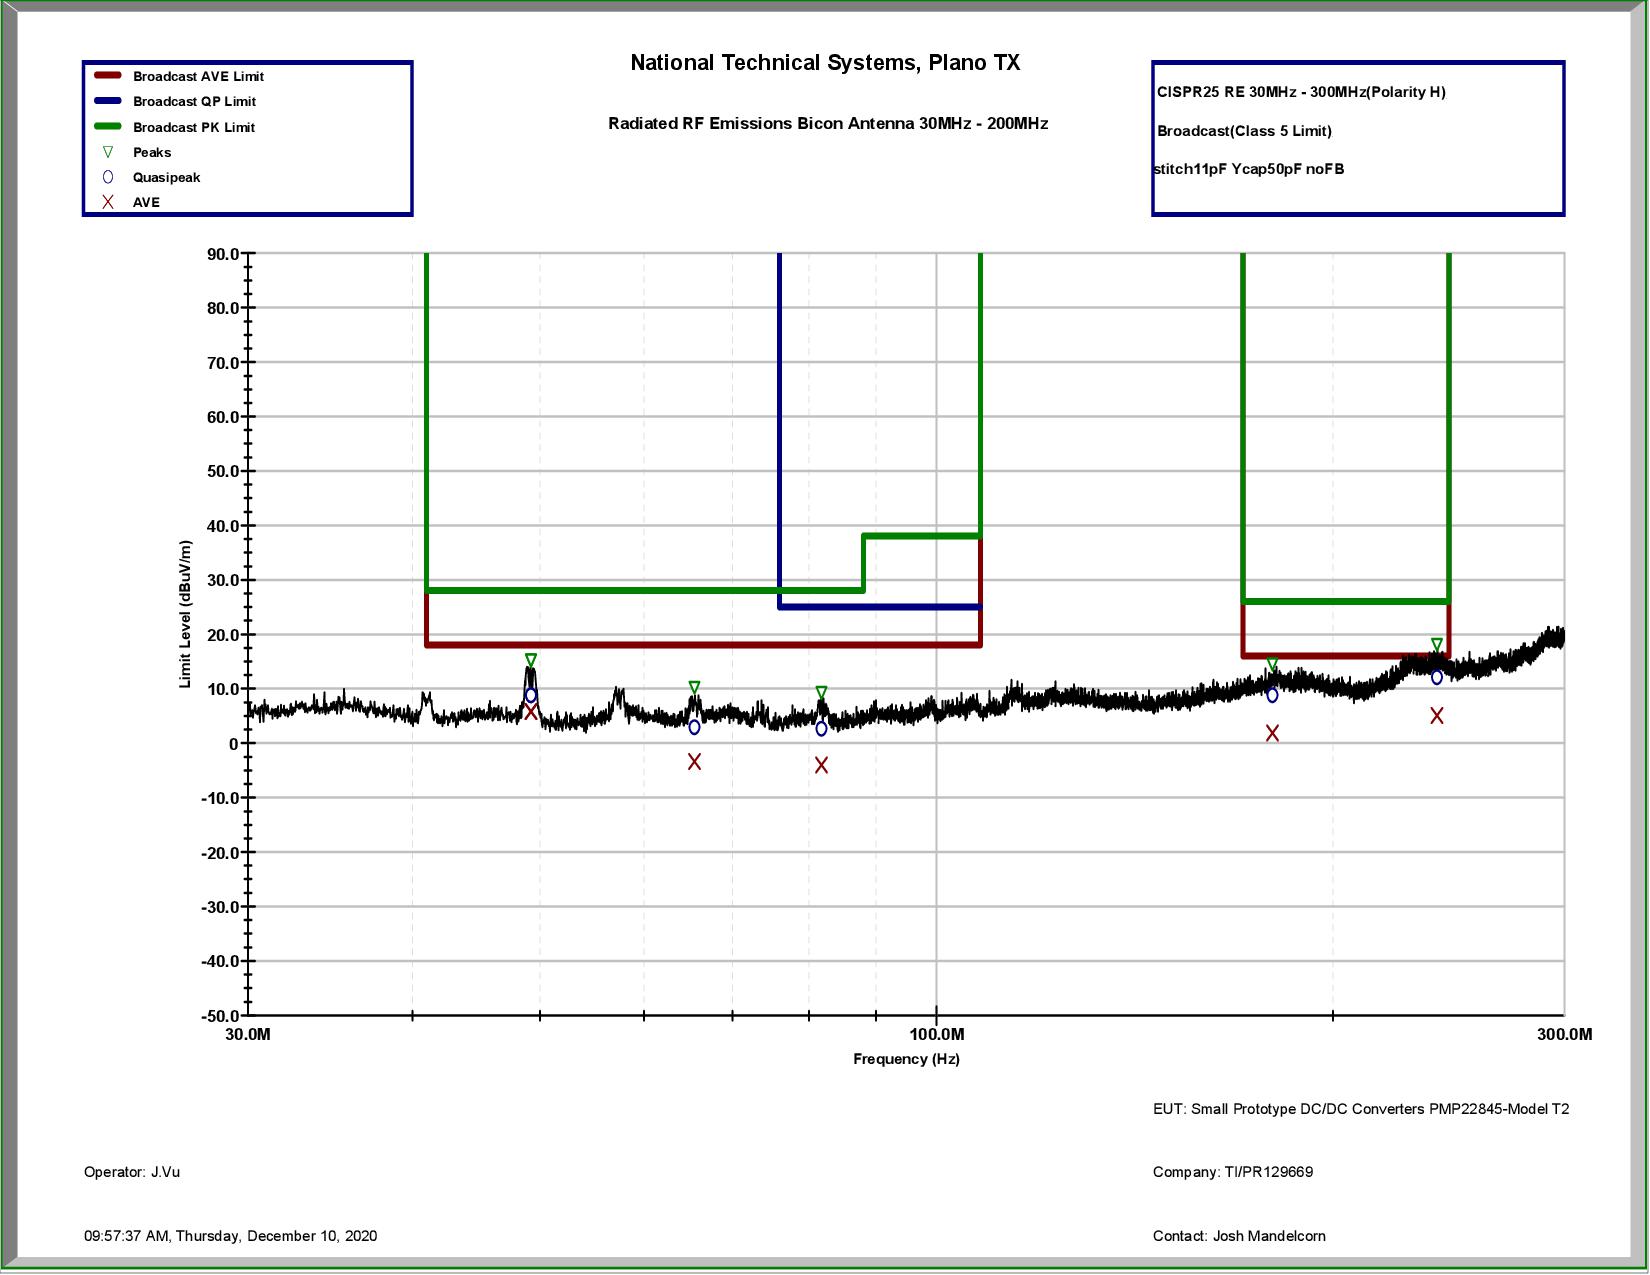 Figure 3-7 30 MHz – 300 MHz Range With
Horizontal Biconical
 Figure 3-8 30 MHz – 300 MHz Range With
Horizontal Biconical Data
Figure 3-8 30 MHz – 300 MHz Range With
Horizontal Biconical DataRadiated mid-band 30 MHz – 300 MHz range with vertical biconical: Worst of the runs with PMP22845 Configuration A: Other runs very similar within about 1 dB.
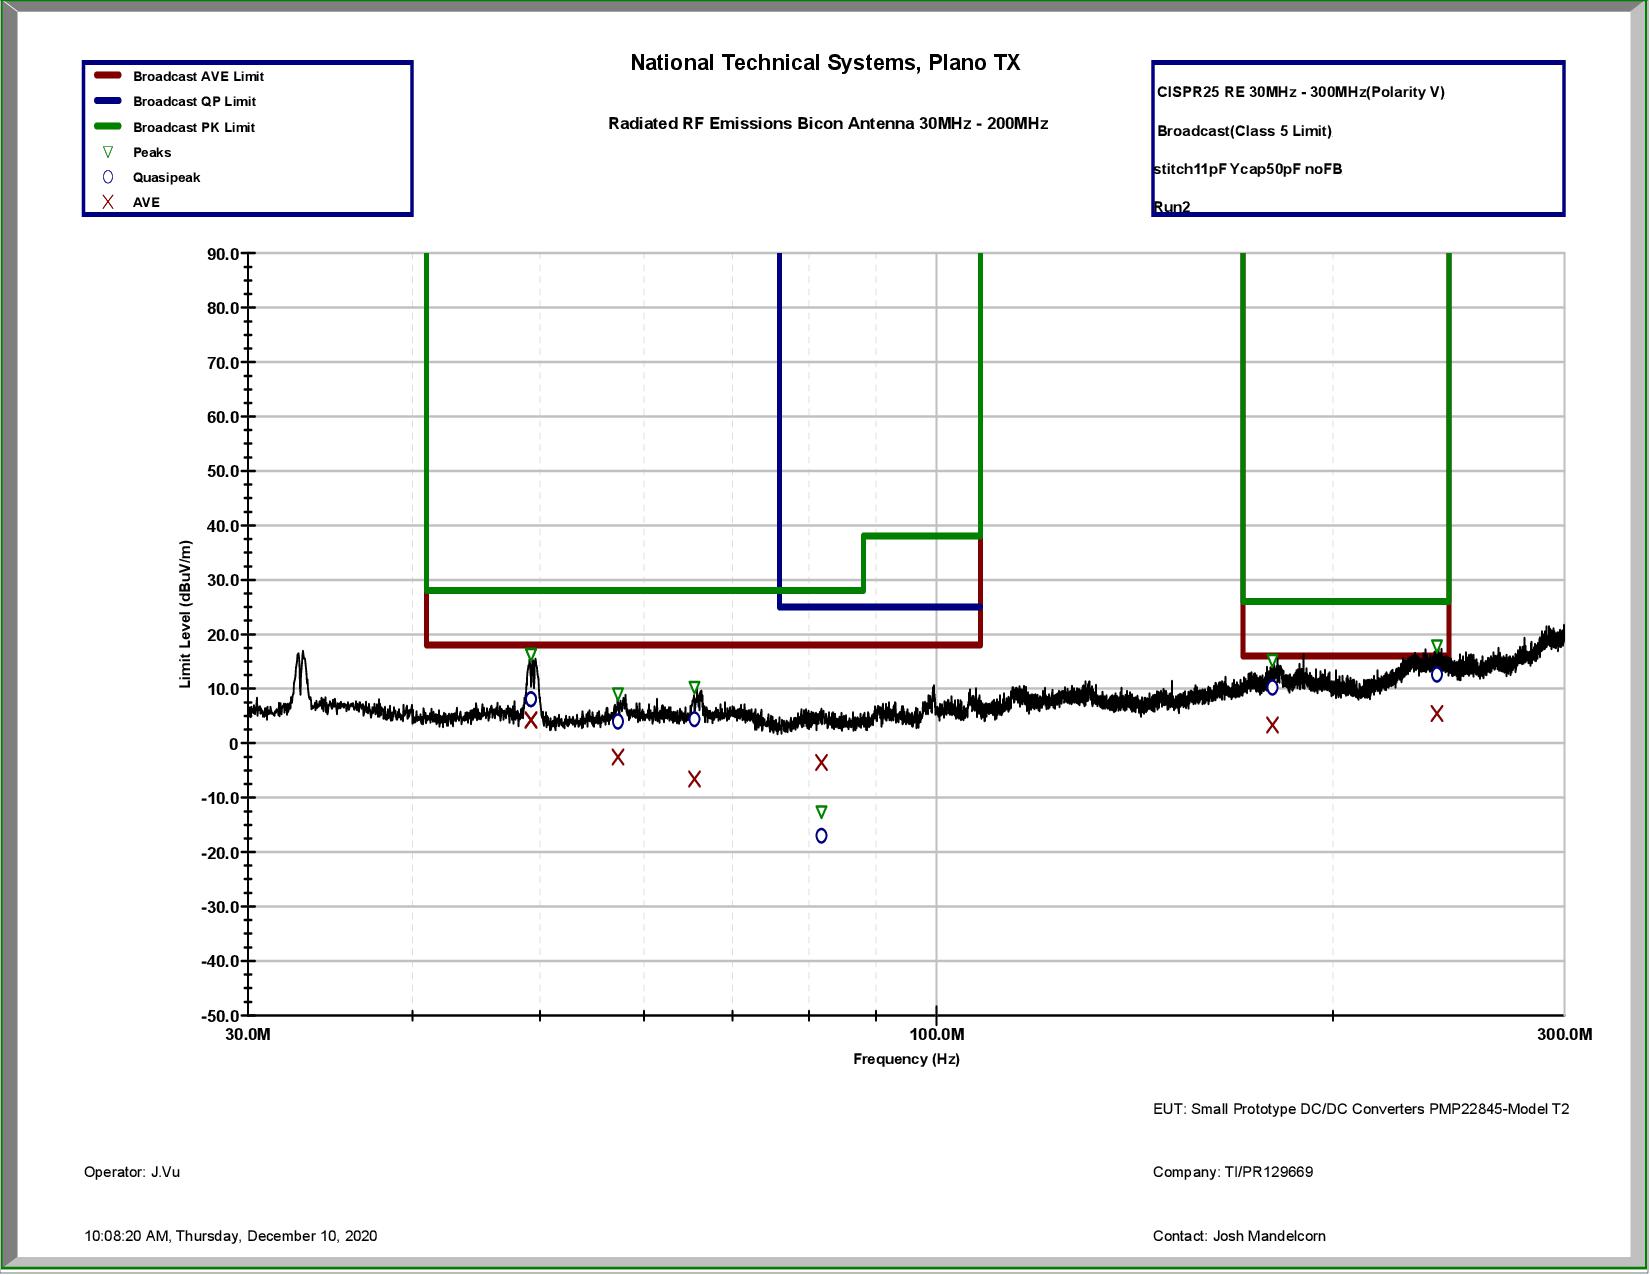 Figure 3-9 30 MHz – 300 MHz Range With Vertical
Biconical
 Figure 3-10 30 MHz – 300 MHz Range With Vertical
Biconical Data
Figure 3-10 30 MHz – 300 MHz Range With Vertical
Biconical DataRadiated high band 200 MHz – 1000 MHz range with horizontal log periodic antenna: Configuration A stitch cap and Y cap of 50 pF
In this frequency range horizontal was several dB worse than vertical. Worst case 240 MHz with 7-dB margin.
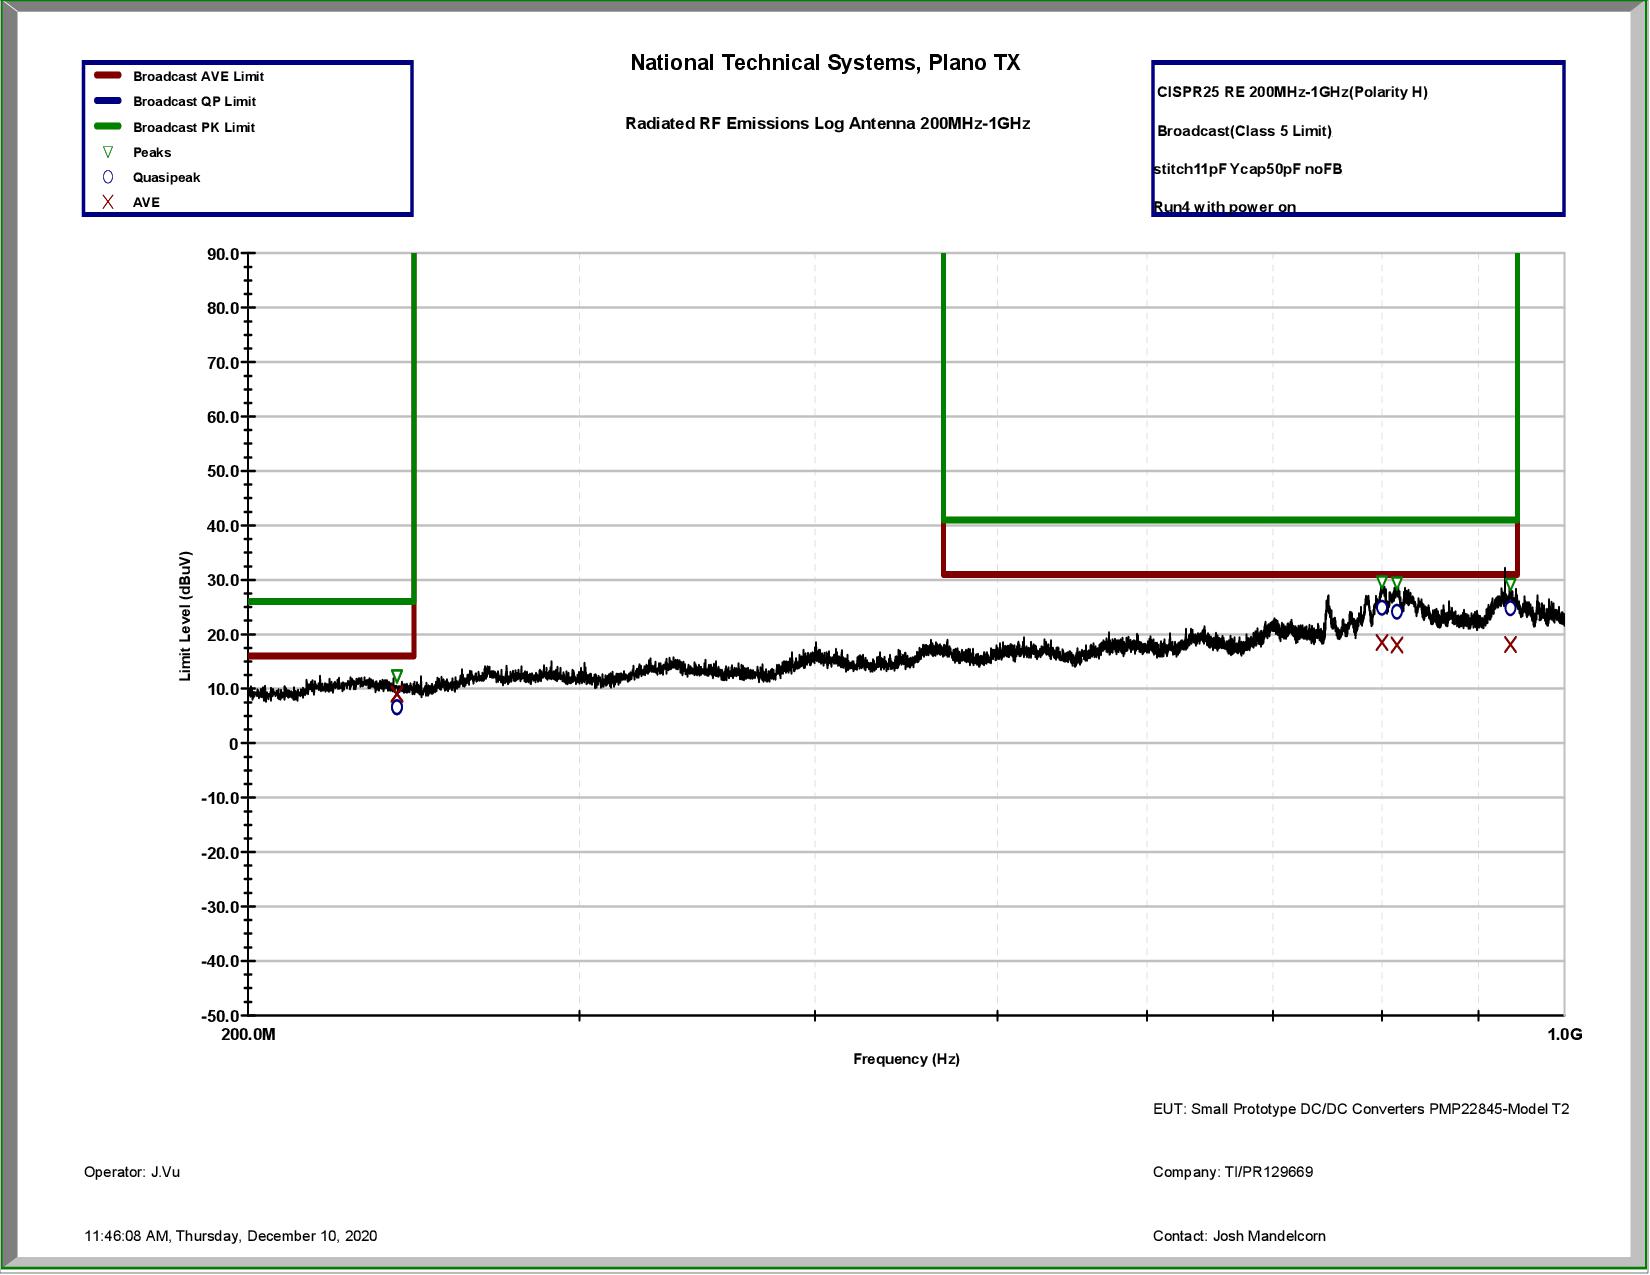 Figure 3-11 200 MHz – 1000 MHz Range With
Horizontal Log Periodic Antenna
 Figure 3-12 200 MHz – 1000 MHz Range With
Horizontal Log Periodic Antenna Data