TIDT388 February 2024
3.3 Load Transient Response
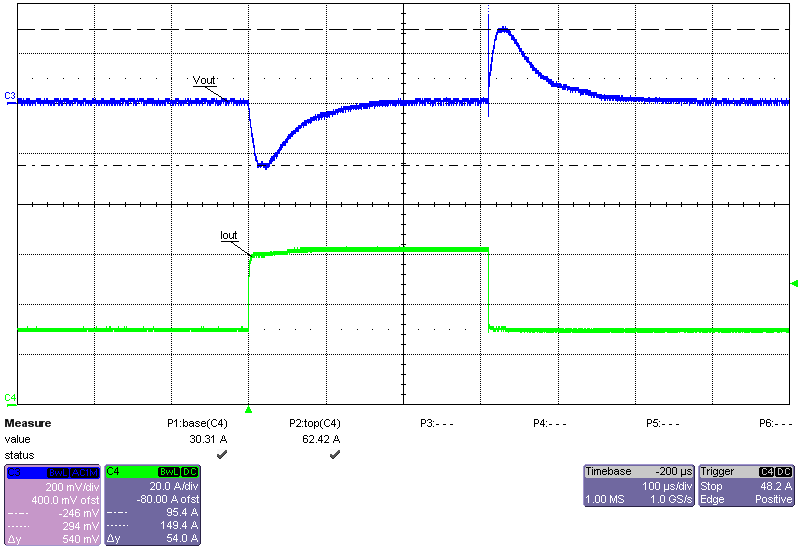
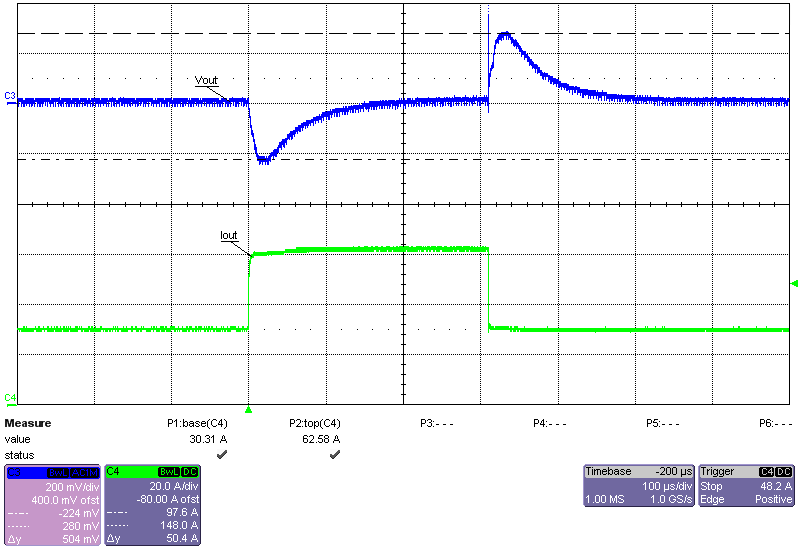
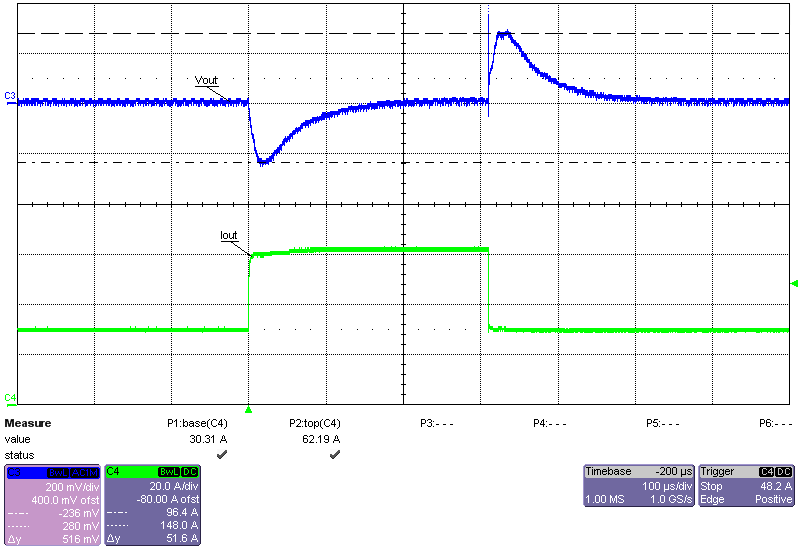
Figure 3-22 through Figure 3-21 show the load transient waveforms of at various input voltages with the output undergoing a 30A-to-60A load step.
 Figure 3-19 Load Transient Response, 24V Input,
30A-to-60A Load Step
 Figure 3-21 Load Transient Response, 60V Input,
30A-to-60A Load Step
 Figure 3-20 Load Transient Response, 48V Input,
30A-to-60A Load Step