TIDUEZ3B april 2021 – april 2023
- Description
- Resources
- Features
- Applications
- 5
- 1System Description
- 2System Overview
- 3Hardware, Testing Requirements, and Test Results
- 4Design and Documentation Support
- 5About the Author
- 6Revision History
3.3.2 Performance Data: Efficiency, iTHD, and Power Factor
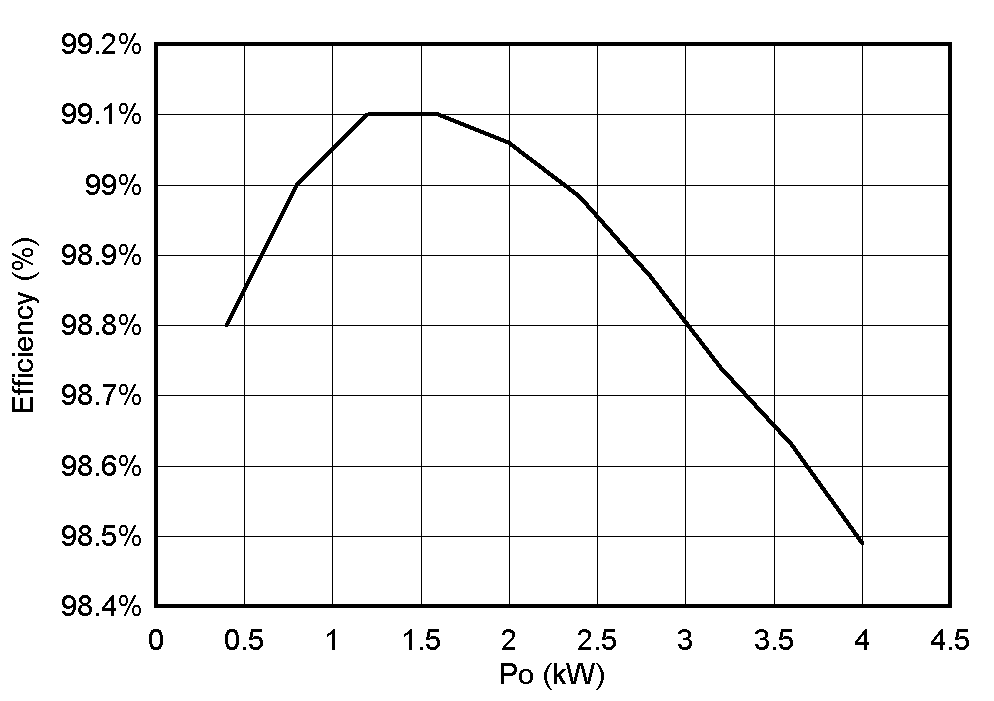
Table 3-1 shows the efficiency, iTHD, and power factor data with 230-V input, without including the control and driving power loss. Figure 3-3 shows the related 230-V efficiency curve.

Figure 3-3 Efficiency Curve, 230 V 175
Table 3-1 Efficiency, iTHD, and Power
Factor Data With 230-V Input
| Vin /Vac | Iin /Aac | Pin /kW | Vout /V | Iout /A | Pout /kW | Eff. | iTHD | PF |
|---|---|---|---|---|---|---|---|---|
| 228.3 | 1.924 | 0.4005 | 401.17 | 0.984 | 0.3946 | 98.80% | 13.65% | 0.984 |
| 226.11 | 3.651 | 0.8021 | 401.22 | 1.982 | 0.7951 | 99.00% | 7.53% | 0.996 |
| 226.89 | 5.37 | 1.2071 | 401.19 | 2.982 | 1.1964 | 99.10% | 5.56% | 0.998 |
| 226.06 | 7.158 | 1.6109 | 401.21 | 3.979 | 1.5963 | 99.10% | 4.20% | 0.999 |
| 225.71 | 8.956 | 2.0158 | 401.11 | 4.978 | 1.9966 | 99.06% | 3.18% | 0.999 |
| 224.82 | 10.802 | 2.4236 | 401.26 | 5.978 | 2.3986 | 98.98% | 3.02% | 0.999 |
| 223.2 | 12.711 | 2.8329 | 401.28 | 6.98 | 2.8009 | 98.87% | 2.75% | 0.999 |
| 222.89 | 14.545 | 3.238 | 401.28 | 7.967 | 3.1968 | 98.74% | 2.49% | 0.999 |
| 222.23 | 16.438 | 3.649 | 401.34 | 8.968 | 3.599 | 98.63% | 2.22% | 0.999 |
| 221.38 | 18.37 | 4.062 | 401.12 | 9.967 | 4.0008 | 98.49% | 2.10% | 0.999 |
Figure 3-4 shows the related 200-V and 277-V efficiency curves.

Figure 3-4 Efficiency Curve, 200 V and 277 V
Table 3-2 and Table 3-3 show the efficiency with 200-V and 277-V input, respectively, without including the control and driving power.
Table 3-2 Efficiency With 200-V
Input
| Pin/kW | VOUT/V | IOUT/A | POUT/kW | Efficiency |
|---|---|---|---|---|
| 0.4006 | 396.12 | 0.996163 | 0.3946 | 98.50% |
| 0.8004 | 396.14 | 1.995759 | 0.7906 | 98.78% |
| 1.2002 | 396.16 | 2.995254 | 1.1866 | 98.87% |
| 1.6008 | 396.16 | 3.994851 | 1.5826 | 98.86% |
| 2.0029 | 396.16 | 4.994194 | 1.9785 | 98.78% |
| 2.4093 | 396.27 | 6.000959 | 2.378 | 98.70% |
| 2.8091 | 396.25 | 6.989022 | 2.7694 | 98.59% |
| 3.2165 | 396.27 | 7.988745 | 3.1657 | 98.42% |
| 3.6249 | 396.27 | 8.988568 | 3.5619 | 98.26% |
| 4.0285 | 396.25 | 9.974763 | 3.9525 | 98.11% |
Table 3-3 Efficiency With 277-V
Input
| Pin/kW | VOUT/V | IOUT/A | POUT/kW | Efficiency |
|---|---|---|---|---|
| 0.4028 | 396.2 | 1.004796 | 0.3981 | 98.83% |
| 0.8013 | 396.21 | 2.004493 | 0.7942 | 99.11% |
| 1.2 | 396.2 | 3.003786 | 1.1901 | 99.18% |
| 1.5991 | 396.22 | 4.003331 | 1.5862 | 99.19% |
| 1.9984 | 396.2 | 5.002776 | 1.9821 | 99.18% |
| 2.3983 | 396.18 | 6.002575 | 2.3781 | 99.16% |
| 2.7949 | 396.22 | 6.991066 | 2.77 | 99.11% |
| 3.1961 | 396.22 | 7.989753 | 3.1657 | 99.05% |
| 3.5982 | 395.22 | 9.012449 | 3.5619 | 98.99% |
| 3.9961 | 396.21 | 9.976275 | 3.9527 | 98.91% |