TIDUEZ8C december 2022 – june 2023
2.3.1 Resistive Bridge
As explained in Section 1, isolation and a high-voltage bus monitoring circuit is implemented in the schematics and printed-circuit board (PCB). Hardware that measures isolation resistance and leakage current is built with a temporary isolation breaking circuit.
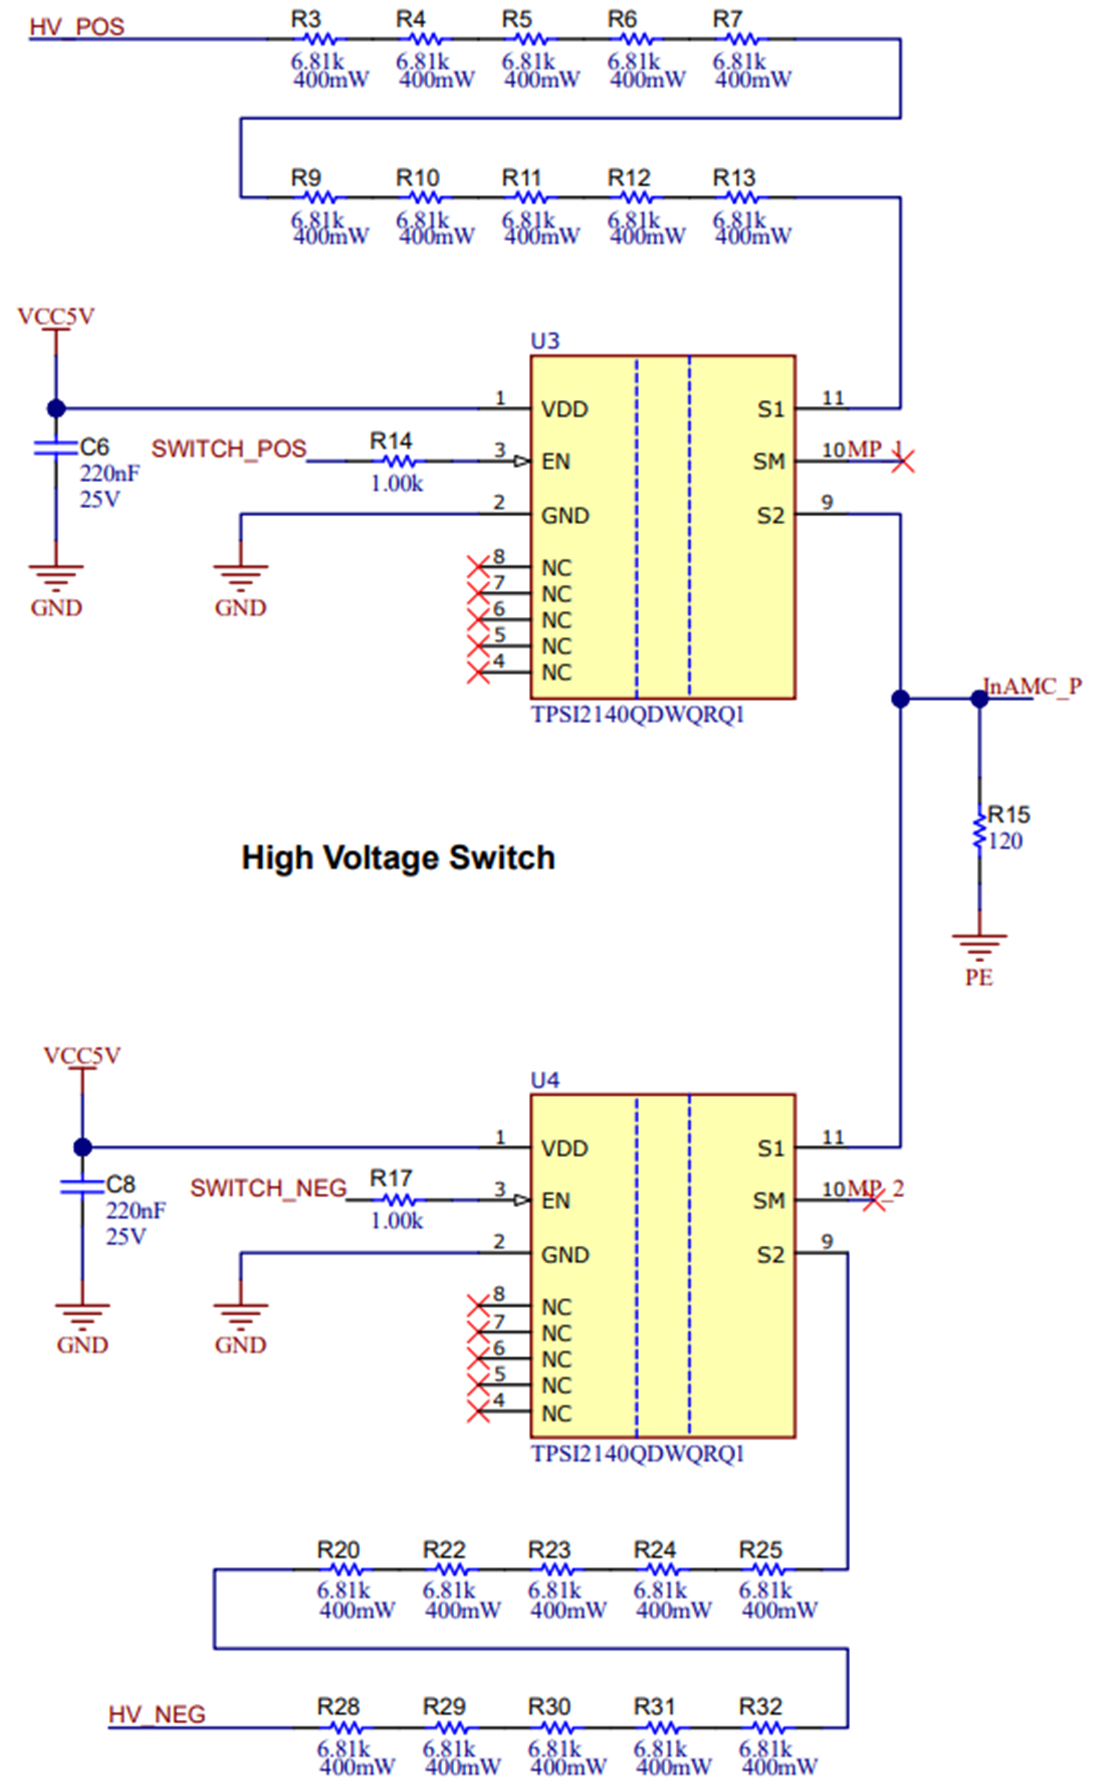
Figure 2-6 shows that RstP consists of R3, R4, R5, R6, R7, R9, R10, R11, R12, and R13, whereas RstN consists of R29, R30, R31, R32, R28, R22, R23, R24, R25, and R20, while RinAMC is implemented in R15. Thin film resistors are chosen because these resistors have less tolerance, high reliability, and a low temperature coefficient of resistance (TCR). Any deviation in resistor values has an impact on the error of interlock leakage current and isolation resistance calculations. Multiple resistors are chosen to reduce the maximum voltage stress and limit the maximum power dissipation per resistor.
 Figure 2-6 Schematic High-Voltage Resistive Bridge
DC fast chargers supply power to 400-V or 800-V battery management systems bypassing the onboard battery charger. Conversely, in string inverters, DC lines coming from the PV string panels go up to 1 kV.
The resistive bridge shown in Figure 2-6 is designed for a 400-V application. In the worst-case situation, the insulation voltage across the restive divider formed by RstP and RinAMC is equal to the bus voltage of 400 V.
As Equation 19 shows, this leads to a maximum input voltage of 0.7 V at the AMC3330 for the selected values of Rst P = 68.1 kΩ and RRinAMC = 120 Ω.
The current allowed through the resistive bridge and the insulation capacitance determines the delay time in the isolated voltage. Further details are found in Section 1.2.