TIDUF25 june 2023 ADS131M08 , MSPM0G1507
- 1
- Description
- Resources
- Features
- Applications
- 6
- 1System Description
- 2System Overview
-
3System Design Theory
- 3.1 How to Implement Software for Metrology Testing
- 3.2 Clocking System
- 3.3 UART Setup for GUI Communication
- 3.4 Real-Time Clock (RTC)
- 3.5 LCD Controller in MSP430FR4131
- 3.6 Direct Memory Access (DMA)
- 3.7 ADC Setup
- 3.8 Foreground Process
- 3.9 Background Process
- 3.10 Software Function per_sample_dsp()
- 3.11 LED Pulse Generation
- 3.12 Phase Compensation
-
4Hardware, Software, Testing Requirements, and Test Results
- 4.1 Required Hardware and Software
- 4.2
Test Setup
- 4.2.1 Connecting the TIDA-010243 to the Metering Test Equipment
- 4.2.2 Power Supply Options and Jumper Settings
- 4.2.3 Electricity Meter Metrology Accuracy Testing
- 4.2.4 Viewing Metrology Readings and Calibration
- 4.2.5 Calibration and FLASH Settings for MSPM0+ MCU
- 4.2.6 Gain Calibration
- 4.2.7 Voltage and Current Gain Calibration
- 4.2.8 Active Power Gain Calibration
- 4.2.9 Offset Calibration
- 4.2.10 Phase Calibration
- 4.2.11 Software Code Example
- 4.3 Test Results
- 5Design and Documentation Support
- 6About the Author
3.10.2 Frequency Measurement and Cycle Tracking
The instantaneous voltages, currents, active powers, and reactive powers are accumulated in 64-bit registers. A cycle tracking counter and sample counter keep track of the number of samples accumulated. When samples of approximately one second have been accumulated, the background process stores these accumulation registers and notifies the foreground process to produce the average results, such as RMS and power values. Cycle boundaries are used to trigger the foreground averaging process because this process produces very stable results.
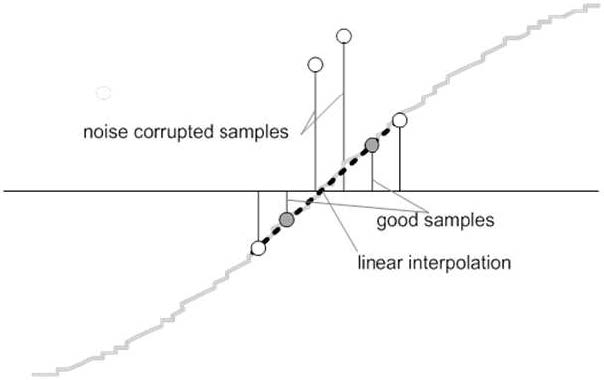
For frequency measurements, a straight line interpolation is used between the zero crossing voltage samples. Figure 3-7 shows the samples near a zero cross and the process of linear interpolation.
 Figure 3-7 Frequency
Measurement
Figure 3-7 Frequency
MeasurementBecause noise spikes can also cause errors, the application uses a rate-of-change check to filter out the possible erroneous signals and make sure that the two points are interpolated from genuine zero crossing points. For example, with two negative samples, a noise spike can make one of the samples positive, thereby making the negative and positive pair appear as if there is a zero crossing.
The resultant cycle-to-cycle timing goes through a weak low-pass filter to further smooth out any cycle-to-cycle variations. This filtering results in a stable and accurate frequency measurement that is tolerant of noise.