TIDUF59 March 2024
3.3.2 Efficiency Test Result
The efficiency result tested burn-in at 100% load conditions at room temperature for 30 minutes, then the load was decreased to 75%, 50%, 25% and 10% load in 5-minute increments to make the system stable. Read the input power by integrated the energy for 1 minute.
The test results at 28V are shown in Table 3-2 to Table 3-5.
| LOAD | VOUT (V) | IOUT (A) | POUT (W) | PIN(W) | EFFICIENCY |
|---|---|---|---|---|---|
| 100% | 27.934 | 5.0093 | 139.93 | 148.18 | 94.43% |
| 75% | 27.935 | 3.7501 | 104.76 | 111.31 | 94.12% |
|
50% |
27.938 | 2.4889 | 69.535 | 74.517 | 93.31% |
|
25% |
27.939 | 1.2459 | 34.810 | 37.558 | 92.68% |
| 10% | 27.939 | 0.4959 | 13.856 | 15.306 | 90.53% |
| Average Efficiency | 93.64% | ||||
| LOAD | VOUT (V) | IOUT (A) | POUT (W) | POUT (W) | EFFICIENCY |
|---|---|---|---|---|---|
| 100% |
27.934 |
5.0093 |
139.93 |
146.31 |
95.64% |
|
75% |
27.935 |
3.7501 |
104.76 |
110.03 |
95.21% |
|
50% |
27.936 |
2.4891 |
69.535 |
73.715 |
94.33% |
|
25% |
27.938 |
1.2460 |
34.810 |
37.144 |
93.72% |
|
10% |
27.939 |
0.4959 |
13.856 |
15.135 |
91.55% |
|
Average Efficiency |
94.72% |
||||
| LOAD | VOUT (V) | IOUT (A) | POUT (W) | PIN (W) | EFFICIENCY |
|---|---|---|---|---|---|
|
100% |
27.934 |
5.0093 |
139.93 |
147.83 |
94.66% |
|
75% |
27.935 |
3.7501 |
104.76 |
110.70 |
94.63% |
|
50% |
27.938 |
2.4890 |
69.538 |
74.253 |
93.65% |
|
25% |
27.938 |
1.2459 |
34.808 |
37.825 |
92.02% |
|
10% |
27.939 |
0.4968 |
13.881 |
15.604 |
88.96% |
|
Average Efficiency |
93.74% |
||||
Table 3-5 shows the efficiency test results at 28V and 90Vac input and full load.
| VPFC (V) | VOUT (V) | IOUT (A) | POUT (W) | PIN (W) | EFFICIENCY |
|---|---|---|---|---|---|
|
390V |
27.934 |
5.0089 |
139.92 |
149.77 |
93.42% |
|
320V |
27.933 |
5.0095 |
139.93 |
149.47 |
93.62% |
Figure 3-23 shows the 28V efficiency comparison curve.
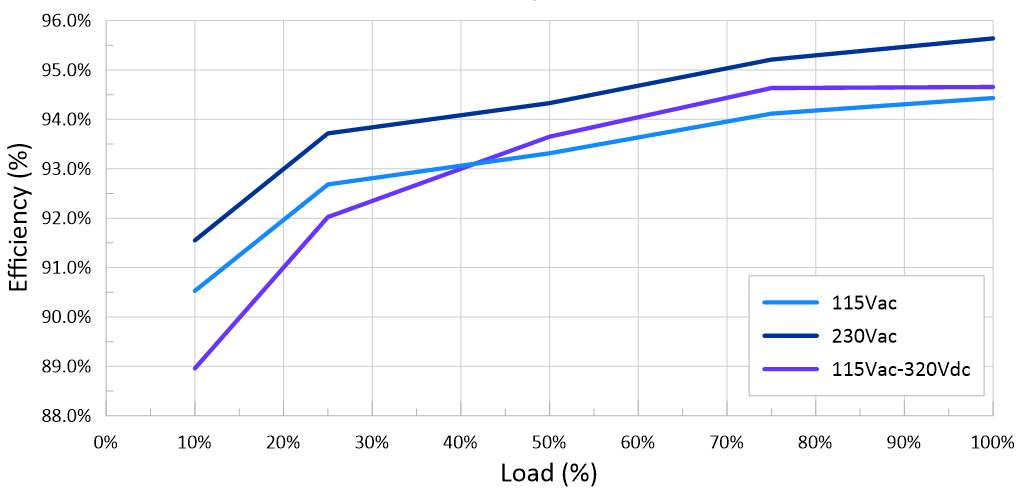 Figure 3-23 Efficiency Result at
VOUT = 28V
Figure 3-23 Efficiency Result at
VOUT = 28VTable 3-6 and Table 3-7 shows the test results at 20V.
|
LOAD |
VOUT (V) |
IOUT (A) |
POUT (W) |
PIN (W) |
EFFICIENCY |
|---|---|---|---|---|---|
|
100% |
20.060 |
4.9960 |
100.22 |
106.730 |
93.90% |
|
75% |
20.060 |
3.7509 |
75.244 |
80.339 |
93.66% |
|
50% |
20.063 |
2.4898 |
49.953 |
53.836 |
92.79% |
|
25% |
20.063 |
1.2468 |
25.015 |
27.187 |
92.01% |
|
10% |
20.064 |
0.4968 |
9.969 |
11.068 |
90.07% |
|
Average Efficiency |
93.09% |
||||
|
LOAD |
VOUT (V) |
IOUT (A) |
PIN (W) |
POUT (W) |
EFFICIENCY |
|---|---|---|---|---|---|
|
100% |
20.060 |
4.9950 |
100.200 |
105.500 |
94.98% |
|
75% |
20.060 |
3.7512 |
75.249 |
79.464 |
94.70% |
|
50% |
20.061 |
2.4910 |
49.971 |
53.278 |
93.79% |
|
25% |
20.061 |
1.2469 |
25.014 |
26.894 |
93.01% |
|
10% |
20.061 |
0.4969 |
9.968 |
10.783 |
92.44% |
|
Average Efficiency |
94.12% |
||||
Figure 3-24 shows the 20V efficiency comparison curve.
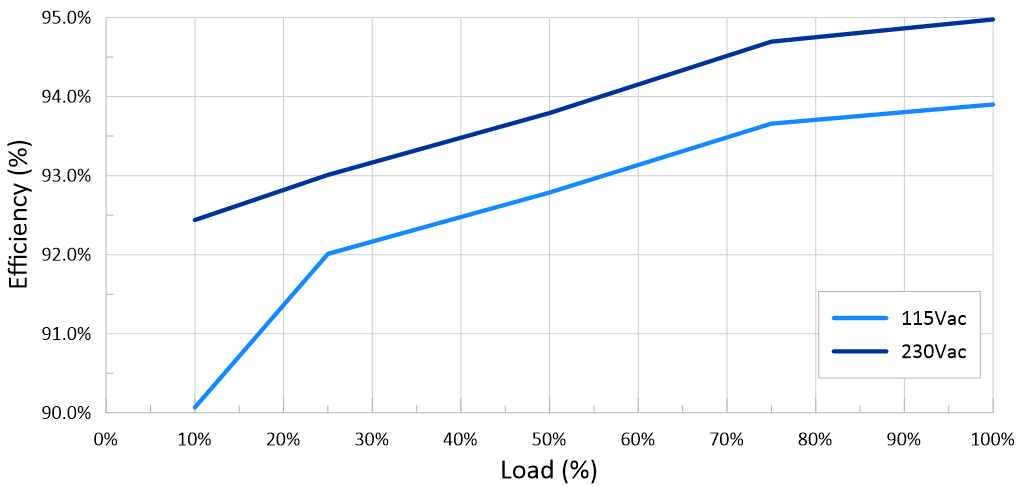 Figure 3-24 Efficiency Result at
VOUT = 20V
Figure 3-24 Efficiency Result at
VOUT = 20VTable 3-8 and Table 3-9 show the test results at 15V.
| LOAD | VOUT (V) | IOUT (A) | POUT (W) | PIN (W) | EFFICIENCY |
|---|---|---|---|---|---|
|
100% |
15.121 |
5.0114 |
75.778 |
81.572 |
92.90% |
|
75% |
15.124 |
3.7509 |
56.728 |
61.308 |
92.53% |
|
50% |
15.125 |
2.4909 |
37.675 |
40.949 |
92.00% |
|
25% |
15.125 |
1.2469 |
18.859 |
20.692 |
91.14% |
|
10% |
15.125 |
0.4969 |
7.515 |
8.527 |
88.13% |
|
Average Efficiency |
92.14% |
||||
| LOAD | VOUT (V) | IOUT (A) | POUT (W) | PIN (W) | EFFICIENCY |
|---|---|---|---|---|---|
|
100% |
15.123 |
5.0117 |
75.792 |
80.679 |
93.94% |
|
75% |
15.123 |
3.7518 |
56.738 |
60.662 |
93.53% |
|
50% |
15.125 |
2.4907 |
37.672 |
40.469 |
93.09% |
|
25% |
15.125 |
1.2477 |
18.872 |
20.467 |
92.21% |
|
10% |
15.121 |
0.4969 |
7.513 |
8.226 |
91.34% |
|
Average Efficiency |
93.19% |
||||
Figure 3-25 shows the 15V efficiency comparison curve.
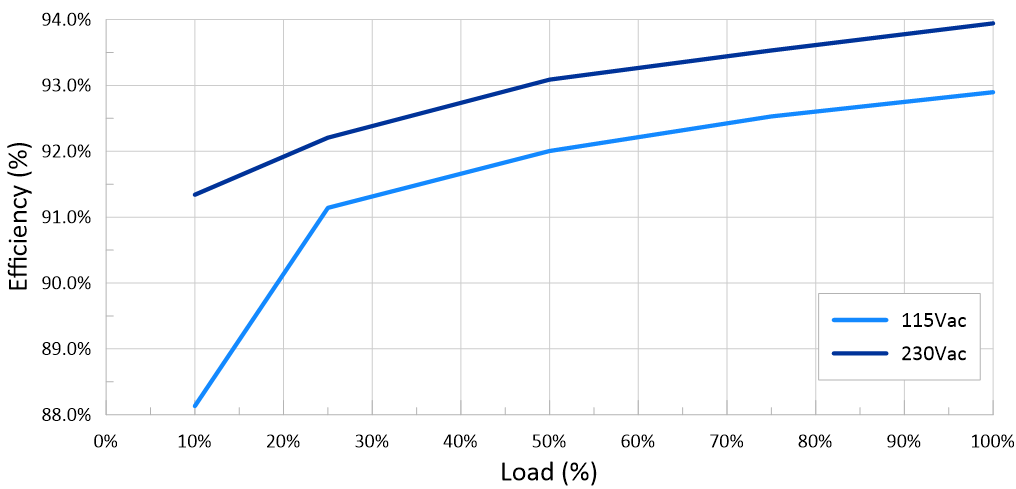 Figure 3-25 Efficiency Result at
VOUT = 15V
Figure 3-25 Efficiency Result at
VOUT = 15VTable 3-10 and Table 3-11 show the test results at 9V.
| LOAD | VOUT (V) | IOUT (A) | POUT (W) | PIN (W) | EFFICIENCY |
|---|---|---|---|---|---|
|
100% |
9.0925 |
2.9991 |
27.269 |
29.639 |
92.00% |
|
75% |
9.0925 |
2.2490 |
20.449 |
22.422 |
91.20% |
|
50% |
9.0938 |
1.4986 |
13.628 |
14.953 |
91.14% |
|
25% |
9.0938 |
0.7488 |
6.809 |
7.689 |
88.56% |
|
10% |
9.0925 |
0.2987 |
2.716 |
3.037 |
89.73% |
|
Average Efficiency |
90.73% |
||||
| LOAD | VOUT (V) | IOUT (A) | POUT (W) | PIN (W) | EFFICIENCY |
|---|---|---|---|---|---|
|
100% |
9.0925 |
2.9992 |
27.270 |
29.398 |
92.76% |
|
75% |
9.0925 |
2.2491 |
20.450 |
22.078 |
92.63% |
|
50% |
9.0925 |
1.4988 |
13.628 |
14.972 |
91.02% |
|
25% |
9.0938 |
0.7490 |
6.811 |
7.826 |
87.03% |
|
10% |
9.0913 |
0.2989 |
2.718 |
3.152 |
86.20% |
|
Average Efficiency |
90.86% |
||||
Figure 3-26 shows the 9V efficiency comparison curve.
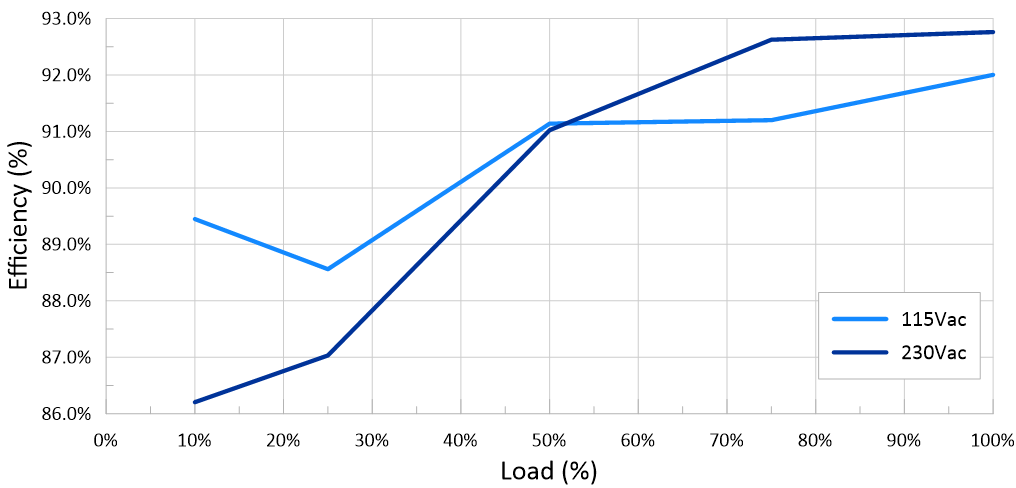 Figure 3-26 Efficiency Result at
VOUT = 9V
Figure 3-26 Efficiency Result at
VOUT = 9VTable 3-12 and Table 3-13 show the test results at 5V.
| LOAD | VOUT (V) | IOUT (A) | POUT (W) | PIN (W) | EFFICIENCY |
|---|---|---|---|---|---|
|
100% |
5.1688 |
2.9997 |
15.505 |
16.999 |
91.21% |
|
75% |
5.1700 |
2.2495 |
11.630 |
12.816 |
90.75% |
|
50% |
5.1700 |
1.4992 |
7.751 |
8.698 |
89.12% |
|
25% |
5.1663 |
0.7474 |
3.862 |
4.540 |
85.06% |
|
10% |
5.1688 |
0.2993 |
1.547 |
1.867 |
82.89% |
|
Average Efficiency |
89.03% |
||||
| LOAD | VOUT (V) | IOUT (A) | POUT (W) | PIN (W) | EFFICIENCY |
|---|---|---|---|---|---|
|
100% |
5.1700 |
2.9988 |
15.504 |
17.021 |
91.09% |
|
75% |
5.1700 |
2.2493 |
11.629 |
13.304 |
87.41% |
|
50% |
5.1700 |
1.4989 |
7.7492 |
8.9764 |
86.33% |
|
25% |
5.1700 |
0.7490 |
3.8722 |
4.8724 |
79.47% |
|
10% |
5.1688 |
0.2989 |
1.5448 |
1.9854 |
77.81% |
|
Average Efficiency |
86.07% |
||||
Figure 3-27 shows the 5V efficiency comparison curve.
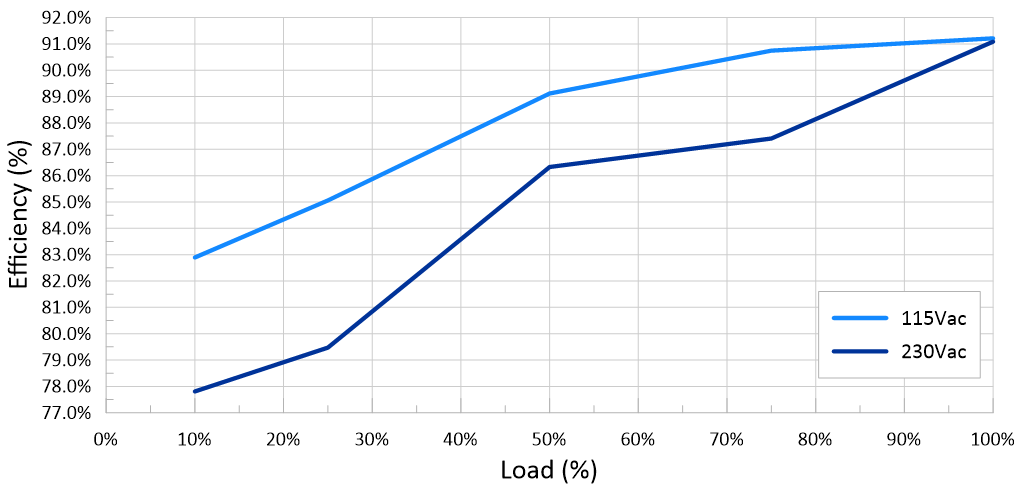 Figure 3-27 Efficiency Result at
VOUT = 5V
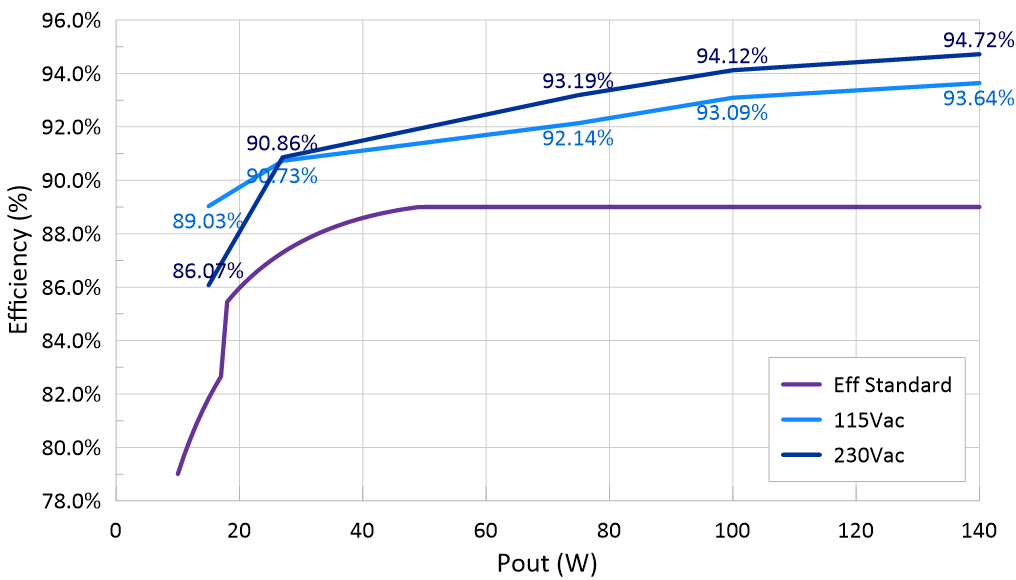 Figure 3-28 Average Efficiency Result of 4
points