SPRACM9B June 2019 – November 2020 TMS320F28384D , TMS320F28384S , TMS320F28386D , TMS320F28386S , TMS320F28388D , TMS320F28388S , TMS320F28P650DH , TMS320F28P650DK , TMS320F28P650SH , TMS320F28P650SK , TMS320F28P659DH-Q1 , TMS320F28P659DK-Q1 , TMS320F28P659SH-Q1
- Trademarks
- 1 Introduction
- 2 Benefits of the TMS320F2838x MCU for High-Bandwidth Current Loop
- 3 Current Loops in Servo Drives
- 4 Outline of the Fast Current Loop Library
- 5 Fast Current Loop Evaluation
- 6 Incremental Build Level 1
- 7 Incremental Build Level 2
- 8 Incremental Build Level 3
- 9 Incremental Build Level 4
- 10Incremental Build Level 5
- 11Incremental Build Level 6
- 12Incremental Build Level 7
- 13Incremental Build Level 8
- 14References
- 15Revision History
11.3 SFRA GUIs
There are two GUIs available to perform the frequency response analysis, one (SFRA_GUI) to plot open loop and plant Bode diagram, and another (SFRA_GUI_MC) to plot open loop and closed loop Bode diagram. They can be invoked and connected to the target platform to study the control loops. The GUI executables are available in the location as mentioned in Section 11.1.
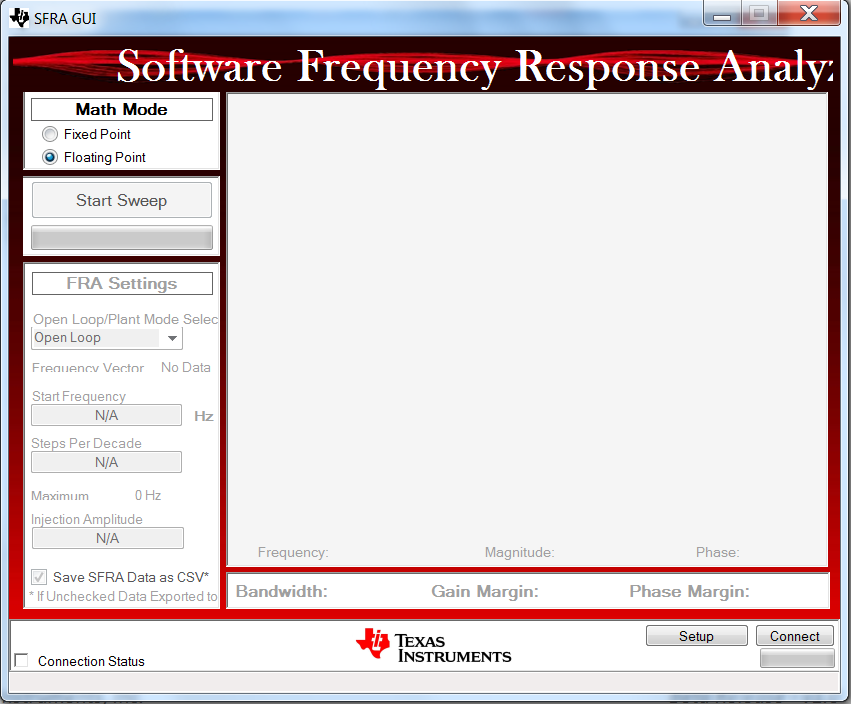
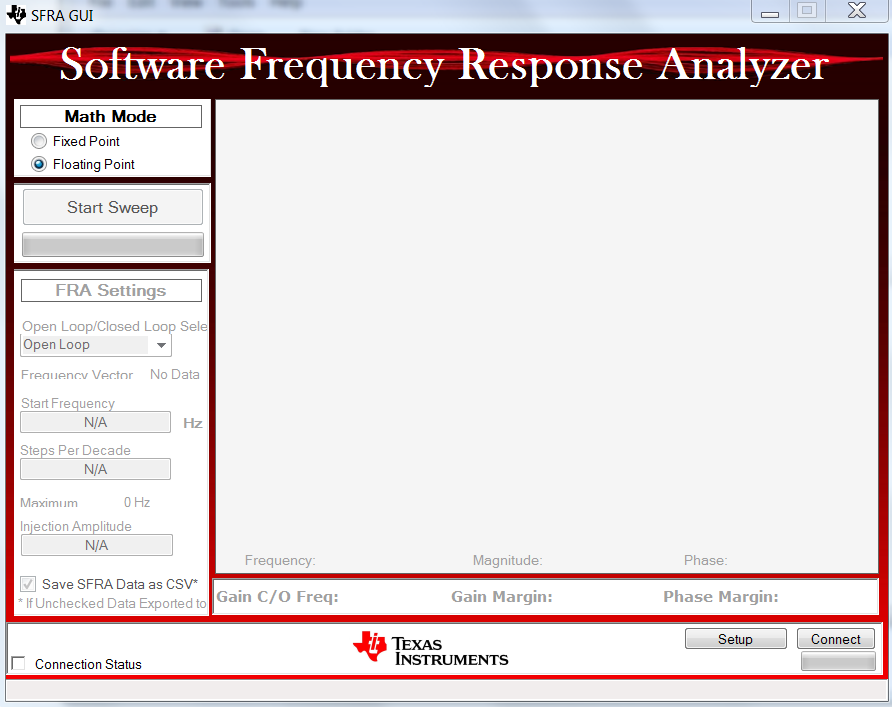
Double click on the choice of GUI executable and the GUI screen will appear as shown in Figure 11-2 for SFRA_GUI or in Figure 11-3 for SFRA_GUI_MC. They look almost identical, the difference is in the pull down menu under 'FRA Settings' starting with the label 'Open Loop'.
- In the SFRA_GUI, this pull down menu helps to select between Open Loop Model and Plant Model.
- In the SFRA_GUI_MC, this pull down menu helps to select between Open Loop Model and Closed Loop Model.
The GUIs interpretation of bandwidth is different.
- In the SFRA_GUI, bandwidth is defined as the open loop gain cross over frequency
- In SFRA_GUI_MC, bandwidth is defined according to Chinese standard GBT 16439-2009 and NEMA ICS 16 (Speed Loop) for servo drives. It defines bandwidth as the frequency where the closed loop output magnitude drops by 3dB or the phase shift lag exceed 90° for the speed loop. It is suggestive that bandwidth is the frequency where the first of these two instances would occur. This approach is used to analyze current loops as well in this demo.
This demo uses the GUI 'SFRA_GUI_MC'. However, you are encouraged to experiment with the other GUI as well to study the plant. With the SFRA_GUI, you can plot the same graph as in SFRA_GUI_MC by passing the argument 'SFRA_GUI_PLOT_GH_CL' in the function configureSFRA(), as shown in the code snippet below.
configureSFRA(SFRA_GUI_PLOT_GH_CL, ISR_FREQUENCY); // to plot GH and CL plots using SFRA_GUIBut the inferences from the plots are not according to that in SFRA_GUI_MC. Therefore, it is advised to configure SFRA for 'SFRA_GUI_PLOT_GH_H' so that you can see open loop, closed loop and plant model plots using these two GUIs, by using one at a time. For digital power applications, SFRA_GUI_MC inferences may not apply and so SFRA_GUI can be used to display closed loop plots as well.
 Figure 11-2 SFRA GUI
 Figure 11-3 SFRA GUI MC