SPRACM9B June 2019 – November 2020 TMS320F28384D , TMS320F28384S , TMS320F28386D , TMS320F28386S , TMS320F28388D , TMS320F28388S , TMS320F28P650DH , TMS320F28P650DK , TMS320F28P650SH , TMS320F28P650SK , TMS320F28P659DH-Q1 , TMS320F28P659DK-Q1 , TMS320F28P659SH-Q1
- Trademarks
- 1 Introduction
- 2 Benefits of the TMS320F2838x MCU for High-Bandwidth Current Loop
- 3 Current Loops in Servo Drives
- 4 Outline of the Fast Current Loop Library
- 5 Fast Current Loop Evaluation
- 6 Incremental Build Level 1
- 7 Incremental Build Level 2
- 8 Incremental Build Level 3
- 9 Incremental Build Level 4
- 10Incremental Build Level 5
- 11Incremental Build Level 6
- 12Incremental Build Level 7
- 13Incremental Build Level 8
- 14References
- 15Revision History
6.1 SVGEN Test
The speedRef value is fed into the ramp control module to ramp up the speed command. The output of the ramp module is fed into a ramp generator to generate the angle for sinewave generation. This angle as well as the variables VdTesting and VqTesting feeds into inverse park transformation block which then feeds into space vector modulation modules to generate three phase PWMs.
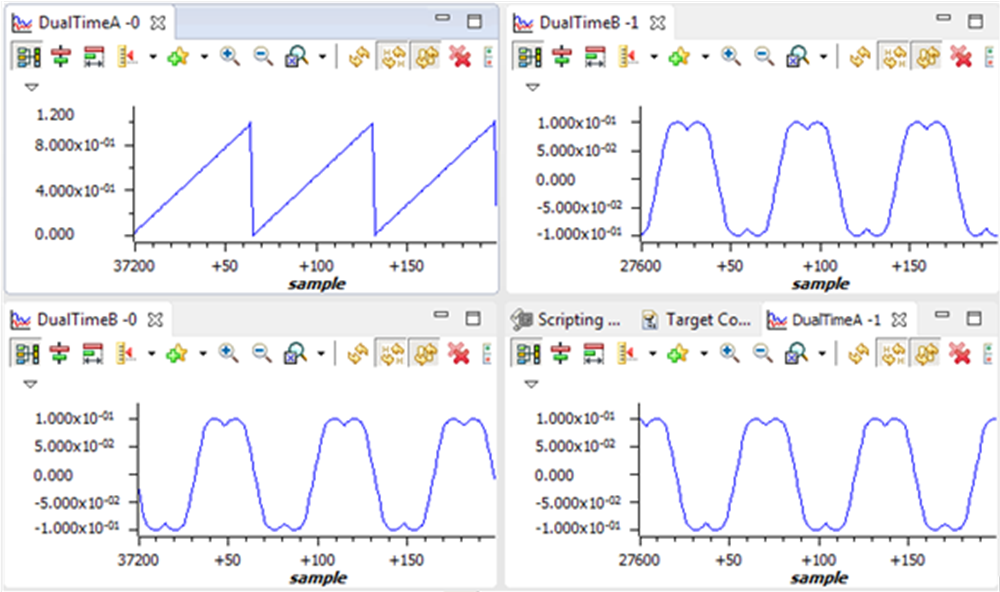
The outputs from space vector generation module can be viewed using the graph tool from the debug environment by clicking Tools --> Graph --> Dual Time. Then, from the graph window, click Import and browse to and select:
\solutions\tmdxiddk379d\f2838x\debug\fcl_f2838x_tmdxiddk_graph1.graphProp
This plots two graphs representing variables pointed by dlogCh1 and dlogCh2. Likewise, another graph can be opened by selecting:
solutions\tmdxiddk379d\f2838x\debug\fcl_f2838x_tmdxiddk_graph2.graphProp
This plots two graphs representing variables pointed by dlogCh3 and dlogCh4.
 Figure 6-3 Voltage Angle and SVGEN Ta, Tb, and Tc
These are shown in Figure 6-3. These are the voltage vector angle, and the pulse width values for the phases A, B, and C and are denoted as Ta, Tb, and Tc, where Ta, Tb, and Tc waveforms are 120° apart from each other. Specifically, Tb lags Ta by 120° and Tc leads Ta by 120°. These are generated based on the values of speedRef, VdTesting and VqTesting. These values can be changed to see the impact on these waveforms. Check the PWM test points on the board to observe PWM pulses (PWM-1H to 3H and PWM-1L to 3L) and ensure that the PWM module is running properly.