SPRAD28 October 2022 AM2431 , AM2432 , AM2434 , AM2631 , AM2631-Q1 , AM2632 , AM2632-Q1 , AM2634 , AM2634-Q1 , AM26C31 , AM26C31-EP , AM26C31C , AM26C31I , AM26C31M , AM26C32 , AM26C32-EP , AM26C32C , AM26C32M , AM26LS31 , AM26LS31M , AM26LS32A , AM26LS32AC , AM26LS32AM , AM26LS33A , AM26LS33A-SP , AM26LS33AM , AM26LV31 , AM26LV31E , AM26LV31E-EP , AM26LV32 , AM26LV32E , AM26LV32E-EP , AM26S10 , AM2732 , AM2732-Q1
- Abstract
- Trademarks
- 1 Building for Debug
- 2 Code Composer Studio Stop-Mode Debugging
- 3 Debug Logging
- 4 Multi-Core Debug
- 5 Debugging Arm Cortex-R5 Exceptions
- 6 Debugging Arm Cortex-M4 Exceptions
- 7 Debugging Memory
- 8 Debugging Boot
- 9 Debugging Real-Time Control Loops
- 10E2E Support Forums
6.2.6 Printing the Stack Frame
As mentioned in the previous sections, when the processor handles an exception, during the entry sequence, it stacks R0 – R3, R12, LR, PC, and xPSR.
When debugging outside of CCS, printing the stack frame to the console might be very useful in order to explore why you end up in an exception. In example, knowing the value of the Link Register (R14) is important to understand where in memory the exception occurred. To print the Stack Frame, you have to know the value of the Main Stack Pointer (MSP) right when the exception happened, so you will be able to print the whole block that contains R0 – R3, R12, LR, PC, and xPSR.
When an exception occurs:
- Go to an Handler code
- Save the MSP
- Print R0 - R3, R12, LR, PC and xPSR (MSP[0] to MSP[7])
In our SDK, exceptions handlers are written in C code. For every C function, the compiler creates a prologue and epilogue sequences that manipulates the MSP register. Thus, if you save the MSP inside the C function, a wrong MSP value is stored. To avoid that, you must use the "naked" attribute and write a naked function in assembly. This attribute tells the compiler that the function is an embedded assembly function, and then prologue and epilogue sequences is not generated for that function by the compiler, and the MSP points to the right value.
Following the above, the sequence of handling a fault is as follows:
- Once an exception occurs, execute
the naked handler function (assembly):
- Save MSP in R0
- Call the C version of the handler code
- Inside the C function:
- Print R0 - R3, R12, LR, PC and xPSR (MSP[0] to MSP[7])
- while(1)
Here is a code example for the modified usageFault_handler() function of the SDK:
__attribute__((naked)) void HwiP_usageFault_handler(void)
{
    __asm ("MRS r0,MSP");
    __asm ("B HwiP_usageFault_handler_c");
}

void HWI_SECTION HwiP_usageFault_handler_c(uint32_t *pMSP)
{
    uint32_t *pUFSR = (uint32_t*)0xE000ED2A;
    volatile uint32_t loop = 1;
    printf("\nUsageFault Exception\n");
    printf("UFSR = %x\n", (*pUFSR) & 0xFFFF);
    printf("Stack Frame: = %p\n", pMSP);
    printf("R0 = %lx\n", pMSP[0]);
    printf("R1 = %lx\n", pMSP[1]);
    printf("R2 = %lx\n", pMSP[2]);
    printf("R3 = %lx\n", pMSP[3]);
    printf("R12 = %lx\n", pMSP[4]);
    printf("LR = %lx\n", pMSP[5]);
    printf("PC = %lx\n", pMSP[6]);
    printf("xPSR = %lx\n", pMSP[7]);

    while(loop)
        ;
}
Example
In order to simulate an usageFault, you can use the previous example where you were trying to execute an undefined instruction from DRAM:
void empty_main(void *args)
{
/* Open drivers to open the UART driver for console */
Drivers_open();
Board_driversOpen();
//Enable all configurable exceptions:
uint32_t *pSHCSR = (uint32_t*)0xE000ED24;
*pSHCSR |= ( 1<< 16); //Memory Manage Fault
*pSHCSR |= ( 1<< 17); //Bus Fault
*pSHCSR |= ( 1<< 18); //Usage Fault
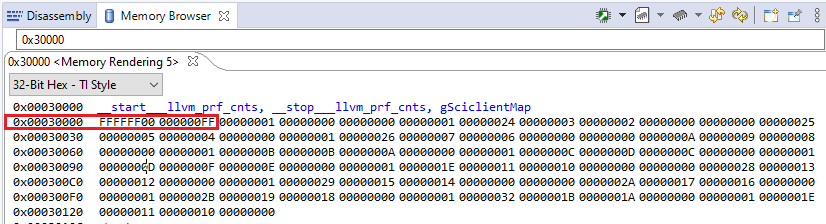
uint32_t* pADDR = (uint32_t*)0x00030001;
*pADDR = 0xFFFFFFFF;
void (*temp_address) (void);
temp_address = pADDR;
temp_address();
while(1);
Board_driversClose();
Drivers_close();
}Once you execute the code above, you will go through the naked usageFault_handler (assembly version) and then jump to the C version and print the whole stack frame:
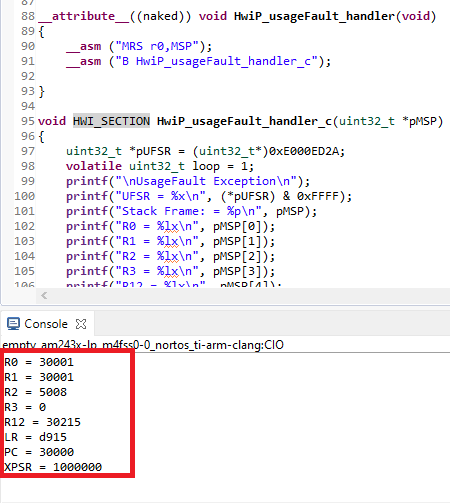
In the image above, you can see that LR = 0x30000, by searching this address in the Disassembly window. You can see the undefined instruction (0xFFFFFFFF) that you were trying to execute: