SLVAED3A July 2019 – April 2024 TPS568230
2.4 Test Results
The efficiency and thermal performance are two important features in real applications. As can be seen from the above analysis, the switching loss and driver loss are directly affected by switching frequency. Table 2-1 lists the test parameters using the TPS568230 device. The TPS568230 has a MODE pin which can set up three different modes of operation for light load running and 600 kHz/800 kHz/1 MHz switching frequency at heavy load. The light load operation in this paper are all select Eco-mode™.
| Fsw/kHz | Vin/V | Vout/V | L/µH | DCR/mΩ | Cin/µF | Cout/µF |
|---|---|---|---|---|---|---|
| 600 | 12 | 1 | 0.68 | 4.7 | 44 | 88 |
| 1000 | 12 | 1 | 0.47 | 3.8 | 22 | 44 |
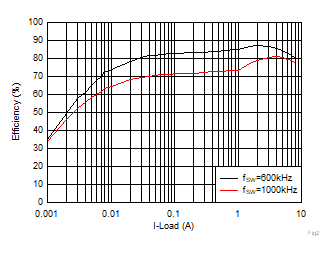
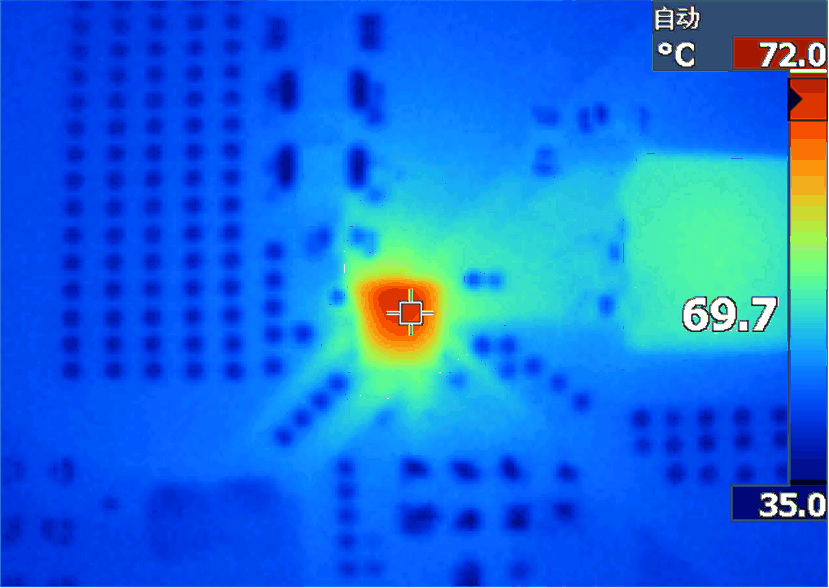
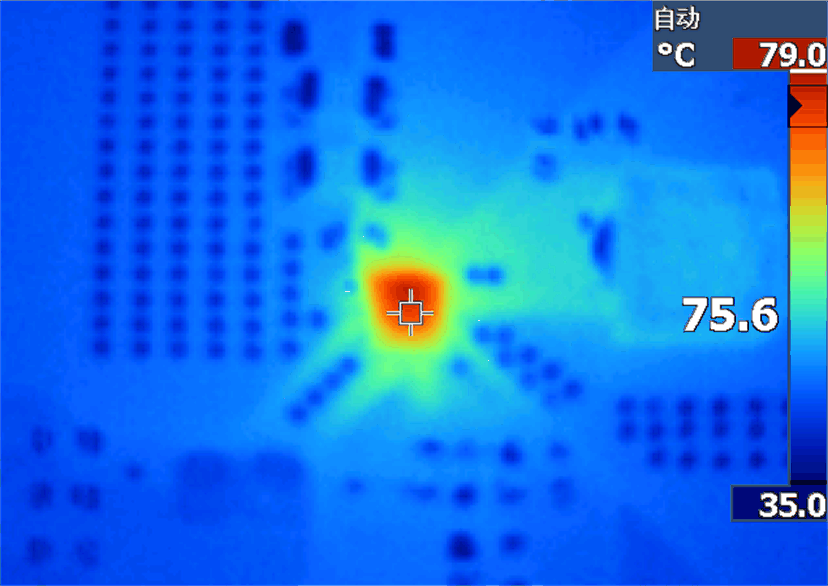
Based on the test condition in Table 2-1, Figure 2-2 shows the efficiency comparison with loading range from 1 mA to 8 A. Figure 2-3 and Figure 2-4 show the thermal comparison results with 8 A loading. It can be concluded that due to the difference of switching loss and driver loss, there is different efficiency and thermal performance in the two frequency conditions. It has higher efficiency and a better thermal result when set to 600 kHz switching frequency.
 Figure 2-2 Efficiency Comparison Data
 Figure 2-3 Thermal, FSW = 600 kHz
 Figure 2-4 Thermal, FSW = 1000 kHz